- March 25, 2024
- Posted by: Dinesh J
- Category: Streamlit
Introduction
Introducing an application built on Streamlit called “Agristat” that provides users with insightful historical agricultural data through interactive charts. This document delves into key visualizations that emphasize agricultural trends over the years.
Data Sourcing
The dataset powering this application is sourced from Kaggle. To streamline the data and enhance usability, it has been cleaned and refined. Originally spanning from 1990 to 2017, we’ve narrowed our focus to the years 2010 to 2017 and selected three specific crops for in-depth analysis.
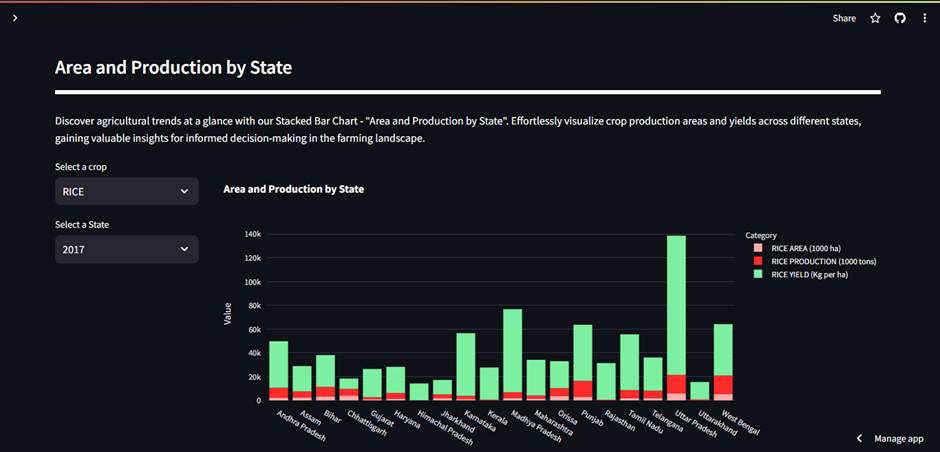
Stacked Bar Chart – “Area and Production by State”
This chart serves as a visual exploration of crucial agricultural metrics, specifically “Area and Production by State.” On the y-axis, essential factors such as area, production, and yield are depicted, while individual states are represented on the x-axis. By dynamically filtering by year and crop, users gain insights into how these metrics vary across states. This interactive feature is invaluable for stakeholders and policymakers, aiding them in making data-driven decisions related to resource allocation and planning in the agricultural sector.
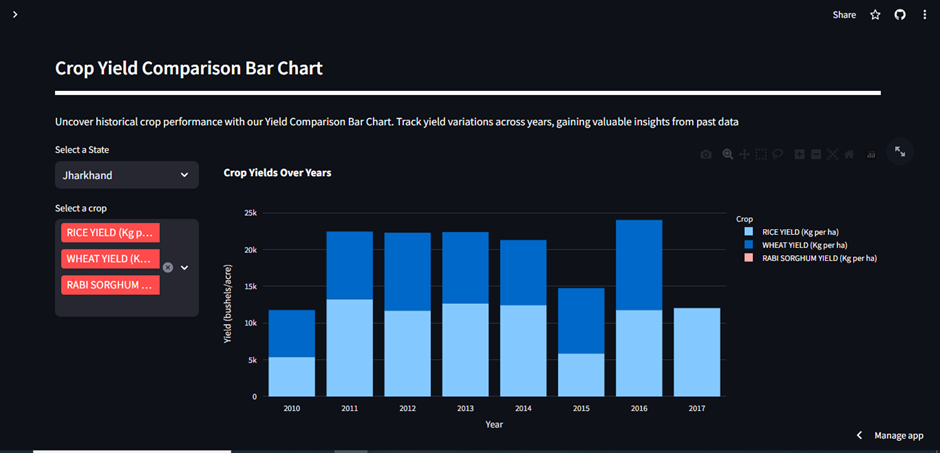
Yield Comparison Bar Chart
Our Yield Comparison Bar Chart provides a comprehensive view of yield variations over time. The x-axis represents years, while the y-axis indicates yield. Users can refine their analysis by applying filters for crops and states. By aggregating the data annually, this chart offers a clear depiction of how yields have evolved across different years.
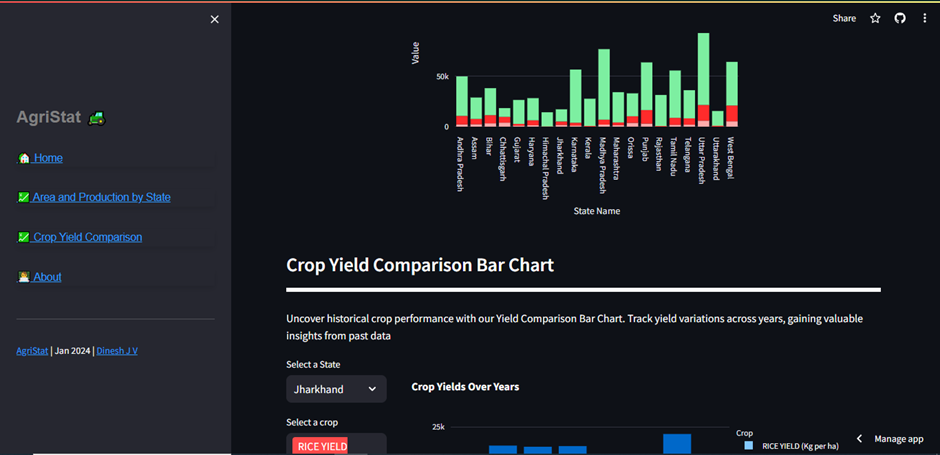
Other Features
In the sidebar, we have adopted a user-friendly approach. Instead of integrating global filters directly onto the charts, the sidebar serves as a navigation bar. This intentional design streamlines the user experience by guiding individuals to different sections of the page.
Conclusion
Exploring historical agriculture data has never been more accessible and insightful than with Streamlit-AgriStat. The interactive visualizations, including the Stacked Bar Chart and Yield Comparison Bar Chart, provide stakeholders and policymakers with valuable insights. The intentional design of the sidebar enhances user navigation, making data analysis a seamless experience.
Visit the AgriStat · Streamlit (agristat-qwerty.streamlit.app)to explore these features firsthand and gain a deeper understanding of historical agricultural trends. Empower yourself with data-driven decision-making in the agricultural sector.
Please feel free to get in touch with us regarding your Streamlit solution needs. Our Streamlit solutions encompass a range of services and tools designed to streamline your data visualization, quick prototyping and dashboard development processes.