
- September 19, 2018
- Posted by: Siva Mani
- Category: Power BI
The latest Power BI features released with the Power BI Desktop September 2018 update. This month update comes with amazing features. Aggregations, M intelligence, and PDF file connector are some of them. This blog will help you to get more details about the features and how to use them. Please do check out previous month features in case if you missed it – What’s new on Power BI Desktop – August 2018 Features.
Here is the feature list of Power BI desktop September 2018 update,
Custom visuals
The following new custom visuals now available in the appsource. You can get the visuals from there.
- Horizon Chart
- Text Enhancer by MAQ Software
- Advance Card
- Multi KPI
Before, check out this blog to enable preview features.
Data connectivity
- PDF file connector (preview)
PDF file connector is released as a preview feature. This feature is highly requested in the Power BI community. To use PDF file connector, it needs to be enabled in Options dialogue since it is a preview feature.
The PDF File connector will appear under the File category in the Get Data dialog once it is enabled.
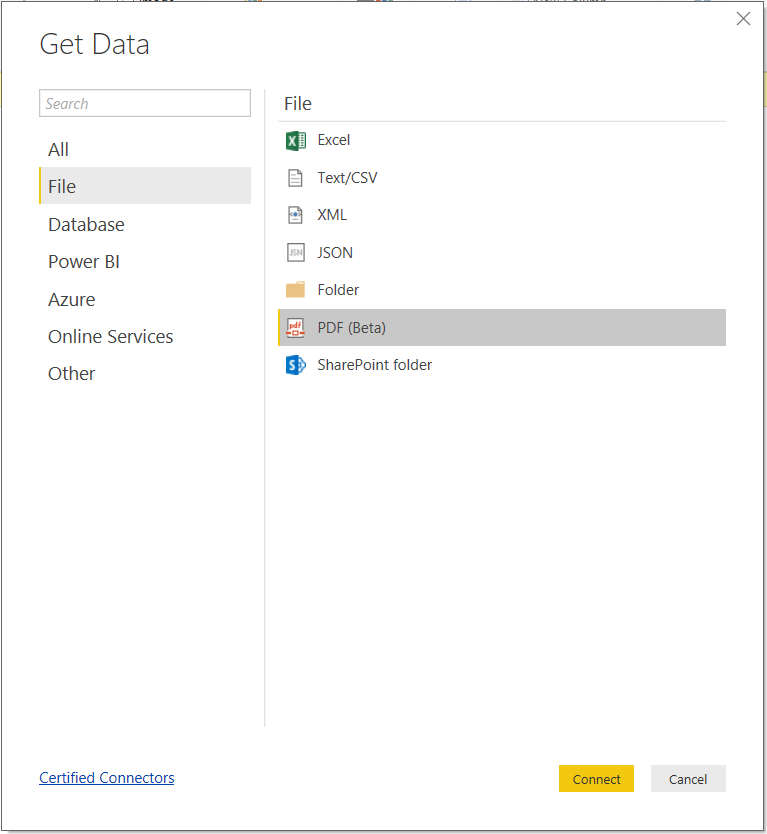
With help of this connector, you can consume data from PDF files. You may experience some performance lack since it is under development.
- SAP BW connector
SAP BW connector supports additional measure properties in Import mode. Hope it will be supported in Direct Query mode as well in future.
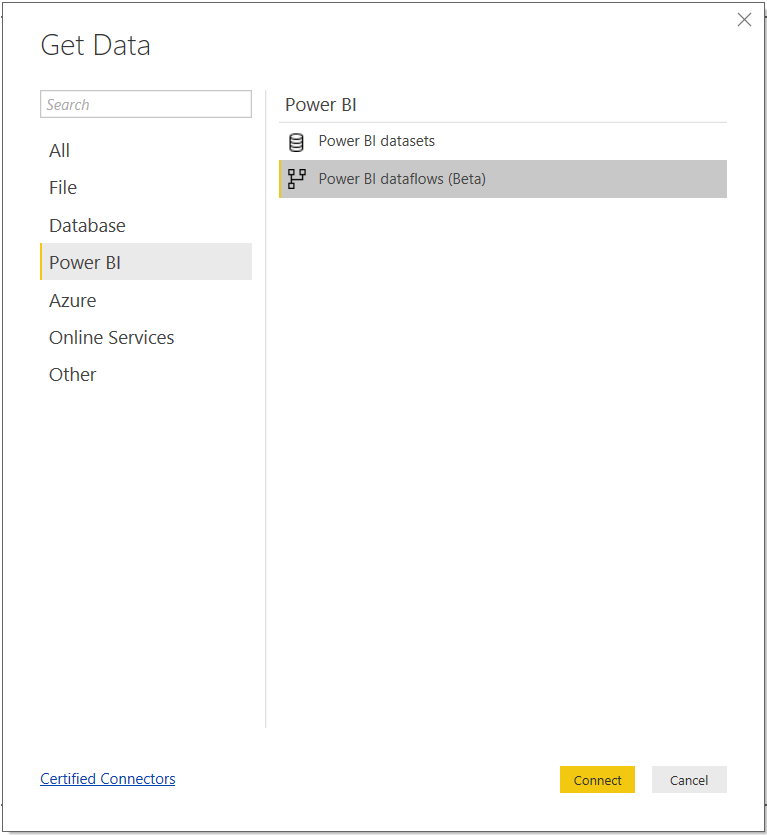
- Dataflows connector (beta)
Dataflow is a preview feature that has self-service data preparation capabilities. It is an integrated part of the Power BI suite. Dataflows are created in Power BI Service.
Dataflows connector allows import data from Power BI dataflows. It is now available as a private preview.
Data preparation
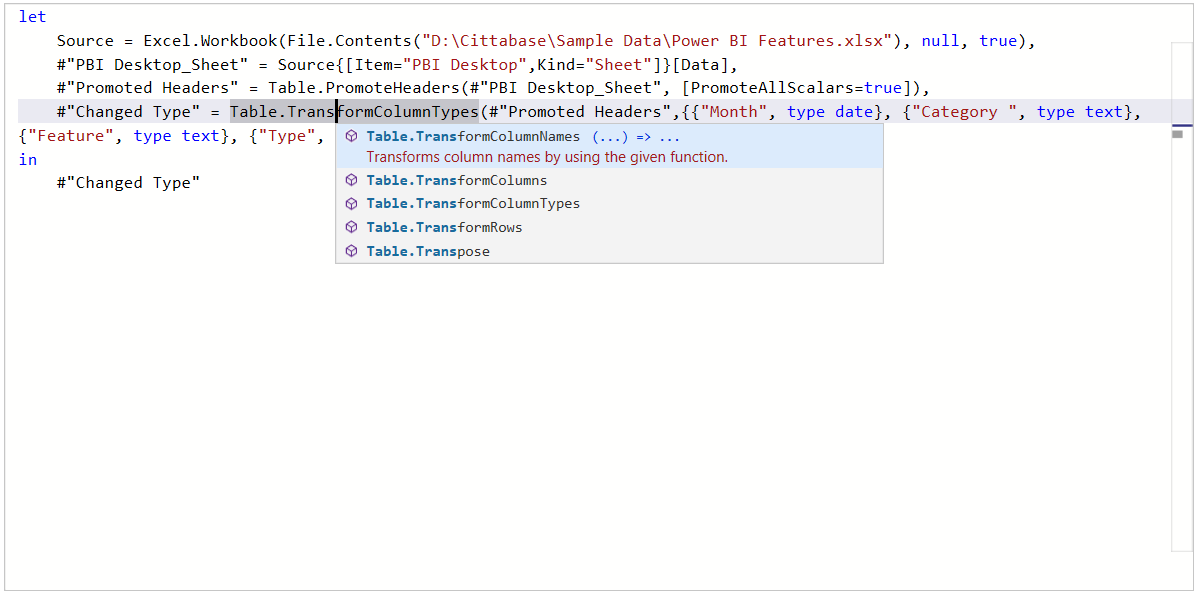
- M Intellisense (preview)
M Intellisense feature is released as a preview feature. It needs to be enabled in Options dialogue. Currently, it is only supported in the Advanced Query Editor. This includes syntax coloring, line numbers, function completions and parameter metadata for M library functions.
- Add Column From Examples
With this month Power BI desktop, Now Add Column From Examples supports new transformation for text padding. It allows making a fixed width of values within a column by adding characters at the beginning or at the end of the original value.
Reporting
- Dot plot layout support in scatter charts
With this feature, you can create dot plots using the Scatter chart by simply adding a categorical field in the x-axis. Make sure that you don’t have any field in the Details bucket.
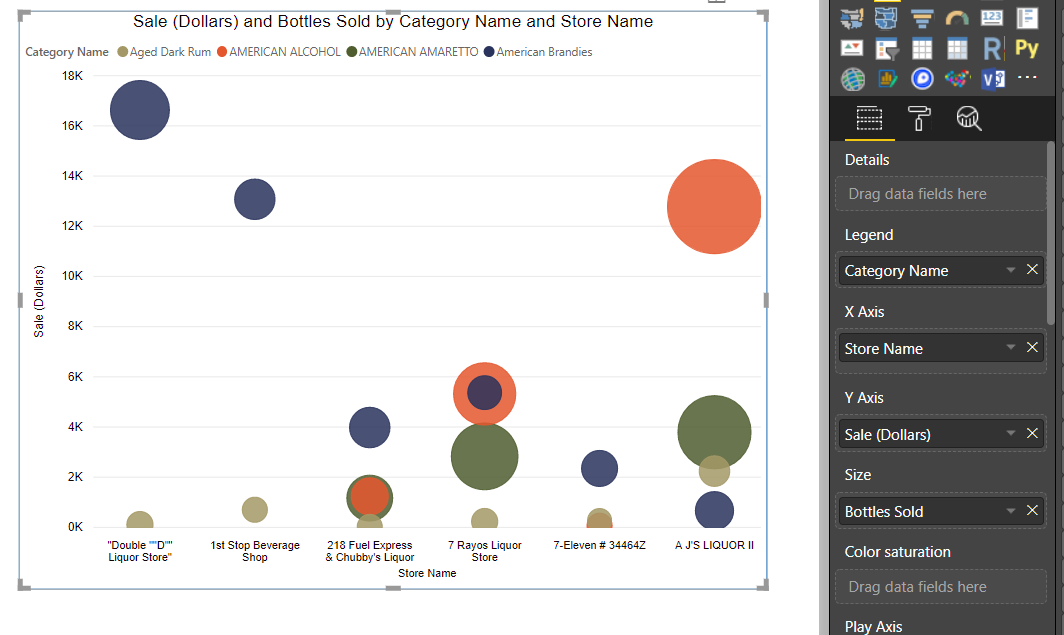
It supports all the formatting features and supports drill down on the x-axis as well.
- Copy value and selection from table & matrix
This feature allows copying data from Power BI to other applications such as Excel or even other Power BI reports. This feature has the ability to copy a specific value or a selection of data from a table or matrix. These options available on the right-click menu.
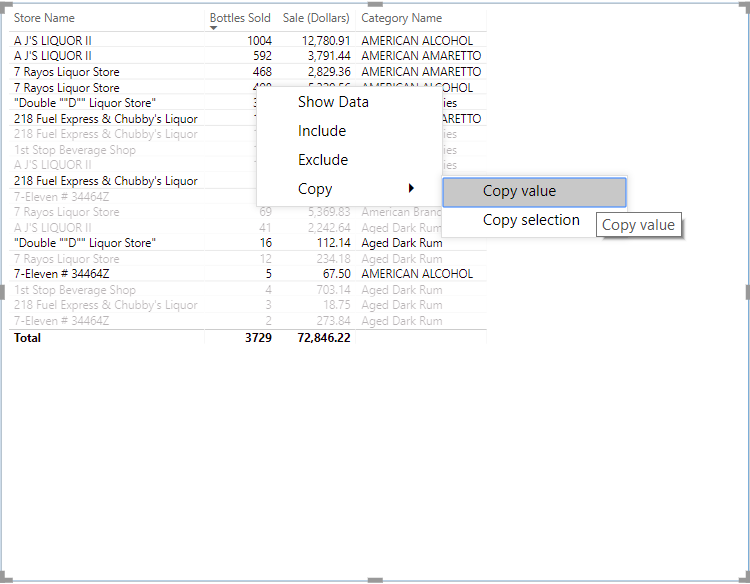
Copy value – it will copy the unformatted value from the cell.
Copy selection – it will copy the selected values including the row and column headers as a tabular version with data formatting.
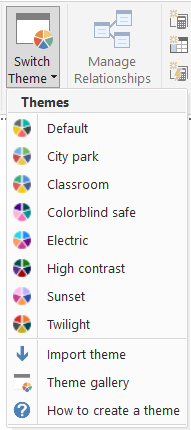
- Built-in report theme options
This new option allows you to pick between available built-in report themes under the Switch Theme button in the Home tab. There are 7 built-in themes available. Power BI will automatically apply the selected theme to the report.
- Report page tooltips generally available & Card support
Report page tooltip is now generally available. With this feature, you can create your own tooltips. It was released as a preview feature with Power BI desktop March 2018 update. It is now supporting on the Card visual as well.
- Accessibility improvements for analytics and formatting pane support
This update comes with keyboard and screen support for Analytics and Formatting pane. These accessibility improvements allow you to change the formatting options using keyboard controls.
Analytics
- Aggregations (preview)
Aggregations feature is one of the great feature released with Power BI desktop September 2018 update. It is a preview feature. With this new feature, you can store summarized values in memory. It will give you faster access to the aggregated data without loading the entire data into Power BI. As the user slice down to the granular level, Power BI automatically passes the query down to the underlying source using DirectQuery. Using aggregations can improve the query performance and data refreshes since it caches the data. It reduces the cache size and the data refresh time by caching data at the aggregated level.
This features only supported in Power BI desktop. Publish a model that uses this feature is not possible since it’s built on top of the Composite Model by mixing different modes (Import and DirectQuery).
- Q&A support for RLS
With this month Power BI desktop update, Q&A supports RLS. The user can only ask natural language question over data that the current user has access. The user only sees results and suggestions that the RLS rules allow them to see.
We hope this blog helps you to find the latest features of Power BI. Please reach out Cittabase for more information.