
- August 1, 2018
- Posted by: Siva Mani
- Category: Power BI
The Power BI Desktop team released an update on 23rd July 2018. This month Power BI Desktop update is mainly focused on enhancements and improvements in various aspects. The feature of the month is the Composite Model from our perspective. It is now available as a preview feature. We are curious about its general availability.
You can find feature list here,
Modeling
- Composite models (preview):
It will allow you to consume data from one or more data sources in direct query mode. You can also combine data using both direct query and import data connectivity mode. Earlier, you can only consume data either using direct query (cannot consume from more than one source) or import mode. Power BI has removed this restriction now. Composite Model is available as a preview feature. To enable this feature in Power BI Desktop, you’ll need to enable the preview here,
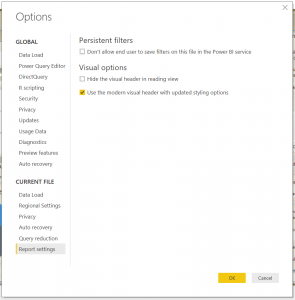
File > Options and settings > Options > Preview features and select Composite models.
Currently publish a model that uses this feature is not possible since it’s in the preview.
Custom visuals
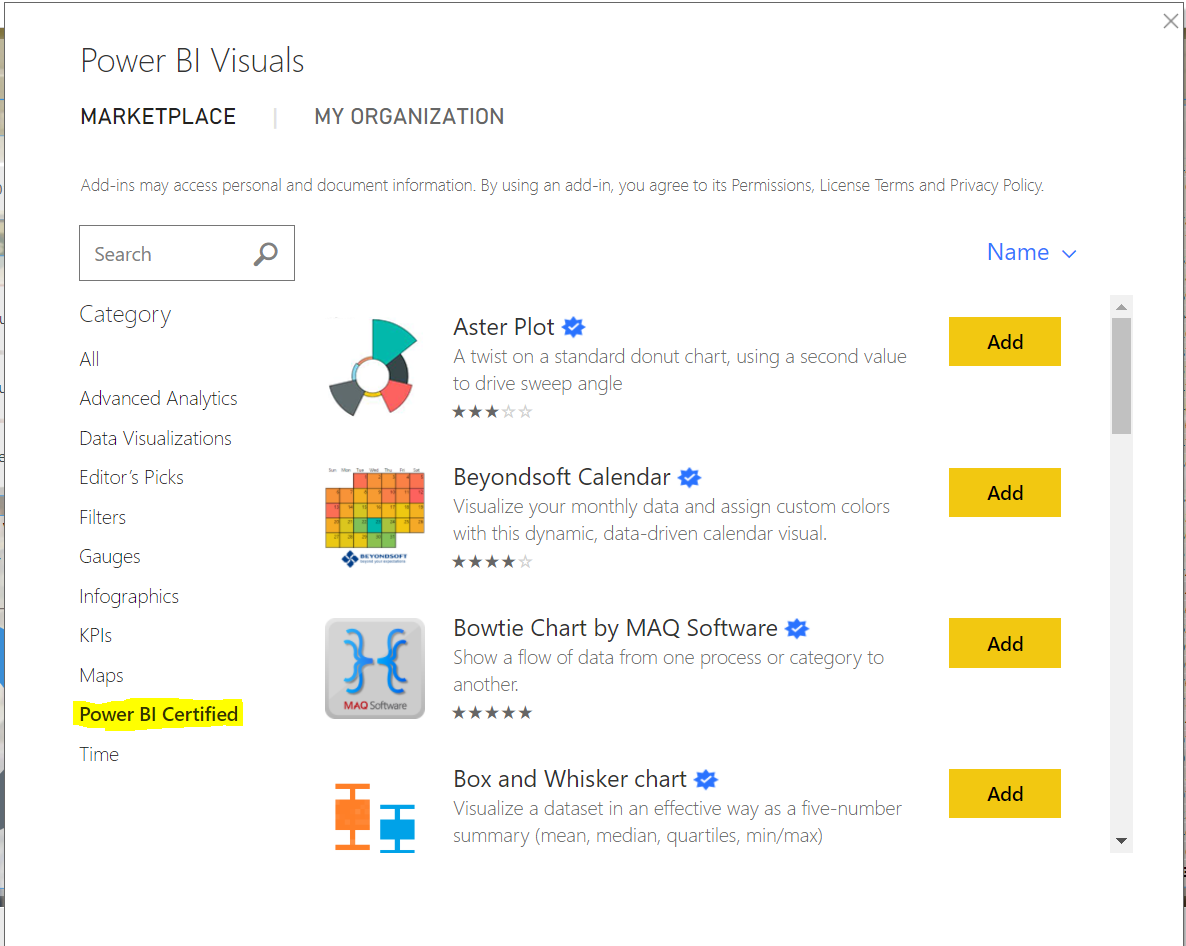
- Power BI certified category :
You can find a new category called Power BI certified in Power BI visuals. It will help you to find certified custom visuals that are available in the marketplace. Also, the blue tick indication is letting you know it’s certified.
- Disabling specific organizational visual:
Power BI announced an Organizational visual feature as a preview on February 2018 and it is generally available from April 2018. This is a repository. You are Power BI administrator can publish custom visuals in Organization’s repository which will be available within your organization. Earlier, There was no option to disable a particular custom visual from the repository. The Power BI team announced this as a feature and it is available now.
- Visio custom visual generally available :
The Visio visual by Microsoft Corporation was released as a preview custom visual on September 2017. It is now generally available. you can create illustrative diagrams using this visual. It will help you to design real-world layouts which help you to drive operational intelligence. You can download it from appsource.
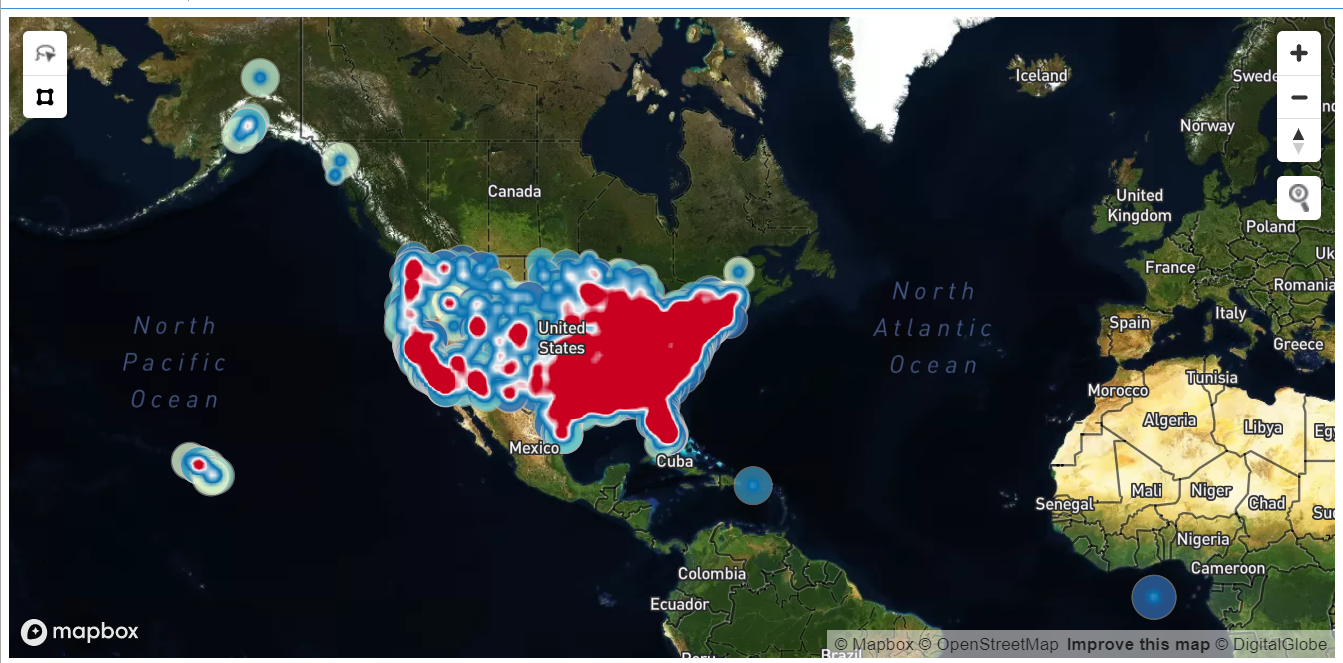
- Mapbox custom visual generally available:
Mapbox Power BI custom visual was initially released as a preview on March 2018. It is now generally available with more features. It allows you to create beautiful maps using its vast level of designing options. For more details, Mapbox visual.
- DataText Box custom visual:
The DataText Box custom visual by Sharewinfo helps you to create a dynamic textbox using JavaScript. It is one of the powerful visual. You can create dynamic content by combining static texts and dynamic values, customizable the layout allows you to add tables, images, and videos. For more details, DataText Box
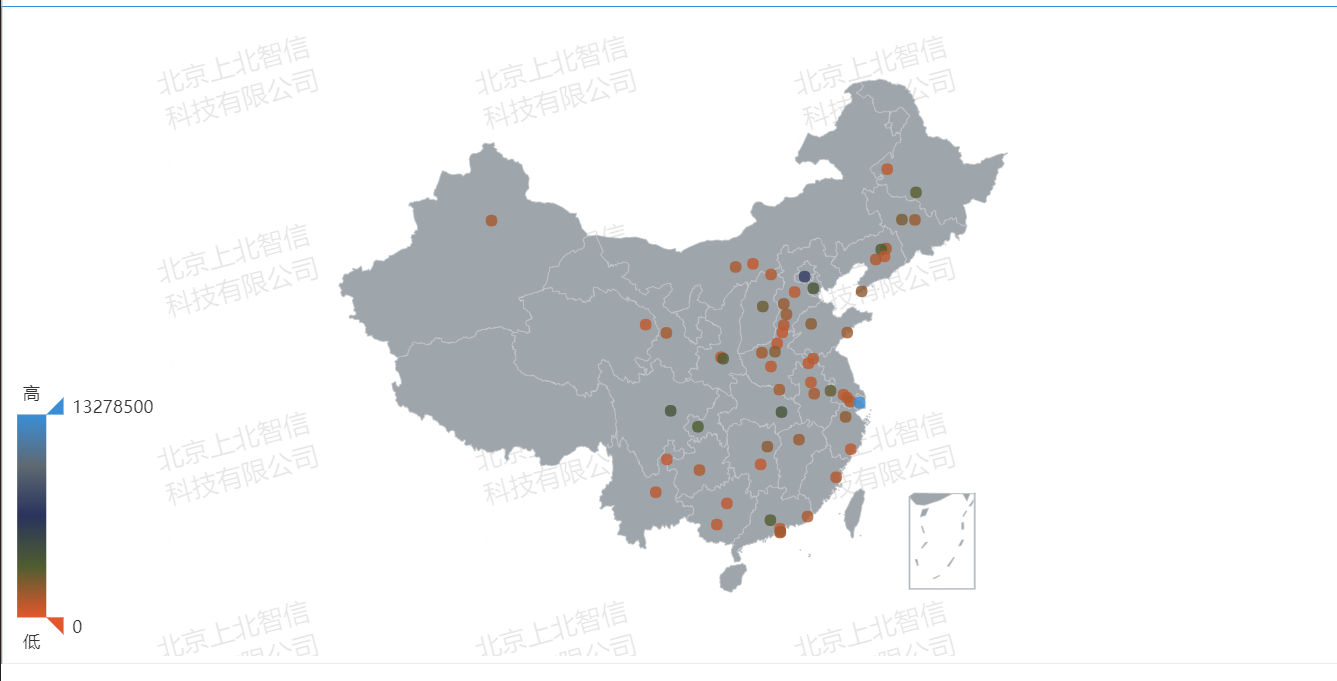
- China Scatter Map custom visual:
The one more visual from Sharewinfo. The China Scatter Map is a bubble map, you can visualize your China location data with the size and color of the data point. It has different map types which allow you to visualize your data of a particular state. For more details, China Scatter Map.
Data Connectivity
- IBM DB2 DirectQuery connector (preview) :
Power BI now supports DirectQuery mode for IBM DB2. It is available as a preview connector. You can enable this preview features similar like Composite Model feature. After enabling this preview feature, you will be able to find the DirectQuery option in IBM DB2 connector dialogue.
- Improvements to Web By Example connector:
The Web connector allows you to scrape data from HTML tables. It was enhanced with this as a preview feature on May 2018. You can extract data from HTML page by providing few samples to Power query to identify the entire set of rows to generate. Here are the improvements with the Power BI desktop July 2018 update,
- Support for importing multiple custom tables
- Automatic completions for specifying sample values
- Exposure of attribute selectors in HTML.Table function
- SAP HANA – Default values for variables in Variable Input experience
You can find more details about reporting features here. We have designed a report, to capture all the reporting features of Power BI desktop July 2018 update.
Reporting
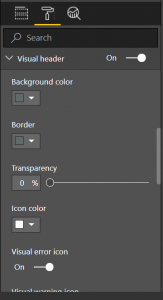
- New visual header with more flexibility and formatting:
This is the most valuable feature on the reporting side. At times I face the problem such as disabling a particular option in the visual header, customizing the visual header. The visual header position based on the visual layout. By default, the header will appear inside the visual top right in line with the title. It will appear on the top of the visual if the visual doesn’t have title or header. If the visual all the way to the top of the report, in that case, it will appear to the bottom of the visual.
You can customize the layout such as background, border, and disabling a particular option (except the options available in more options) from the visual header using the visual header property under Format pane.
Note: The changes will not be available your report in Power BI desktop since it is in design mode. The changes will be available in the Power BI service once the report published. To use this new feature in your old reports, you have to enable it in the Options dialog under the Report settings section.
- Wallpaper formatting:
You can format the grey area outside your report page with this new feature either by setting a color or an image. The formatting options are similar to what you have for report pages such as color, transparency and add image. You can now create a theme for the entire area of the report.
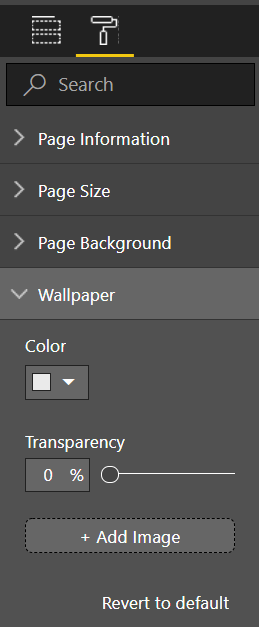
You can make your report page transparent and have your visuals float on top of the wallpaper like below,
- Theming update – more visual and page control (preview):
You can create a custom theme for your report using JSON. The Custom theme feature allows you to reuse the theme. It is available since March 2017 as a preview feature. With this update, you can theme the visual container properties such as the title, border, and background color.
Here is a sample json code for visual style section,
“visualStyles”: {
“*”: {
“*”: {
“title”: [
{
“show”: true,
“fontcolor”: {
“solid”: {
“color”: “#120309”
}
},
“alignment”: “center”,
“fontSize”: 12,
“fontFamily”: “Arial”
}
]
}
}
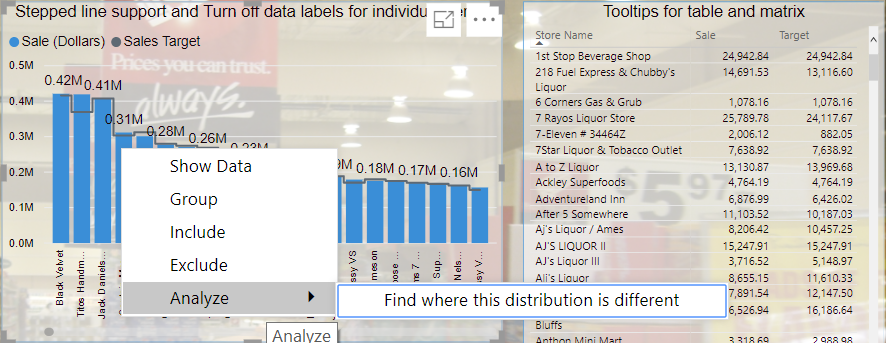
- Tooltips for table and matrix:
The Table and matrix visuals now support both standard and report page tooltips. We go for these visuals when we want to analyze the data at a more granular level. In that case, we might compromise the size of the values due to the number of fields in the visual. It is difficult to see the value of a particular cell. This new feature has eliminated that difficulty. You can customize the tooltip using report page tooltips feature. You need to enable the Tooltip property under the Format pane.
It will look like below,
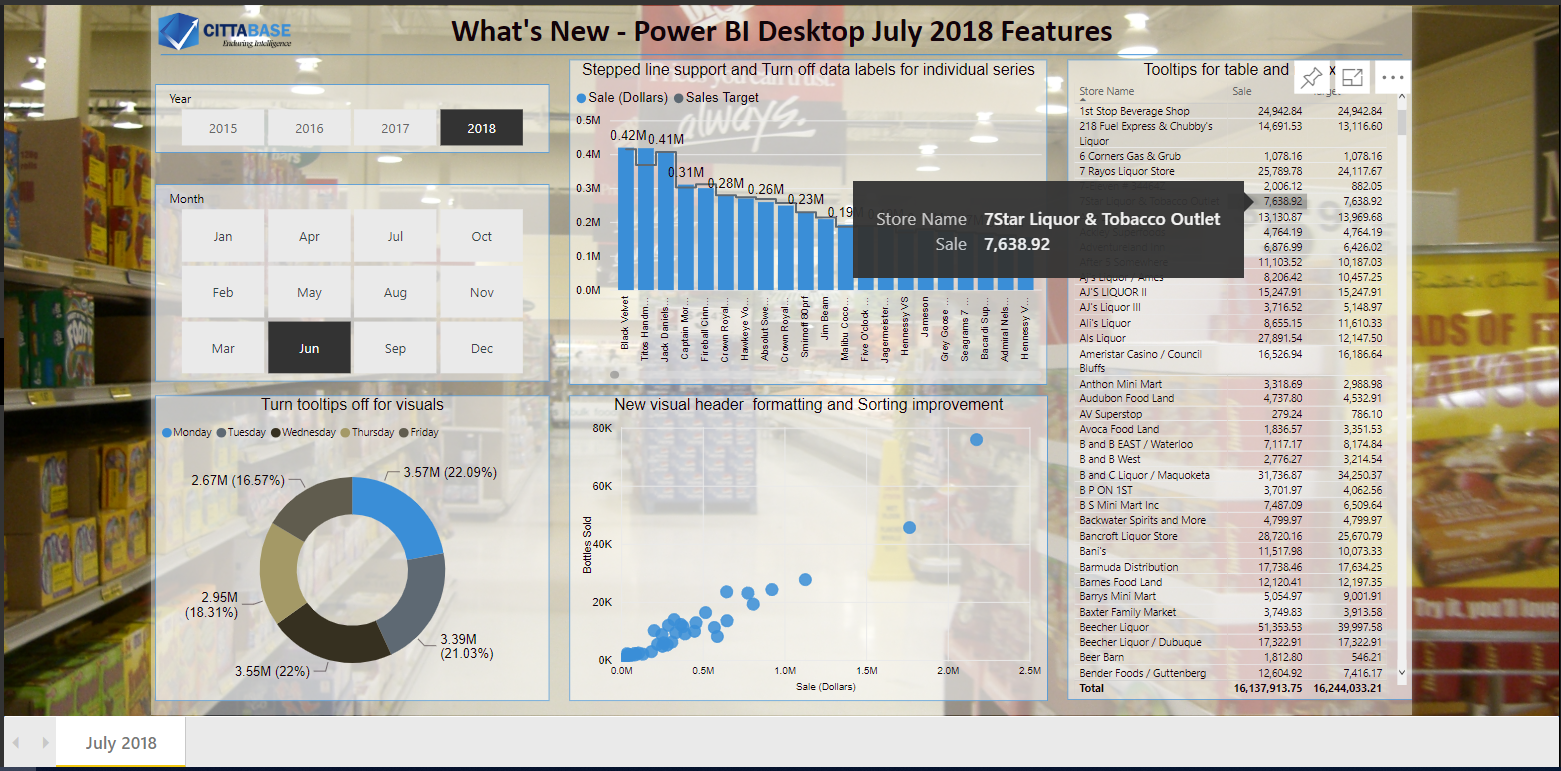
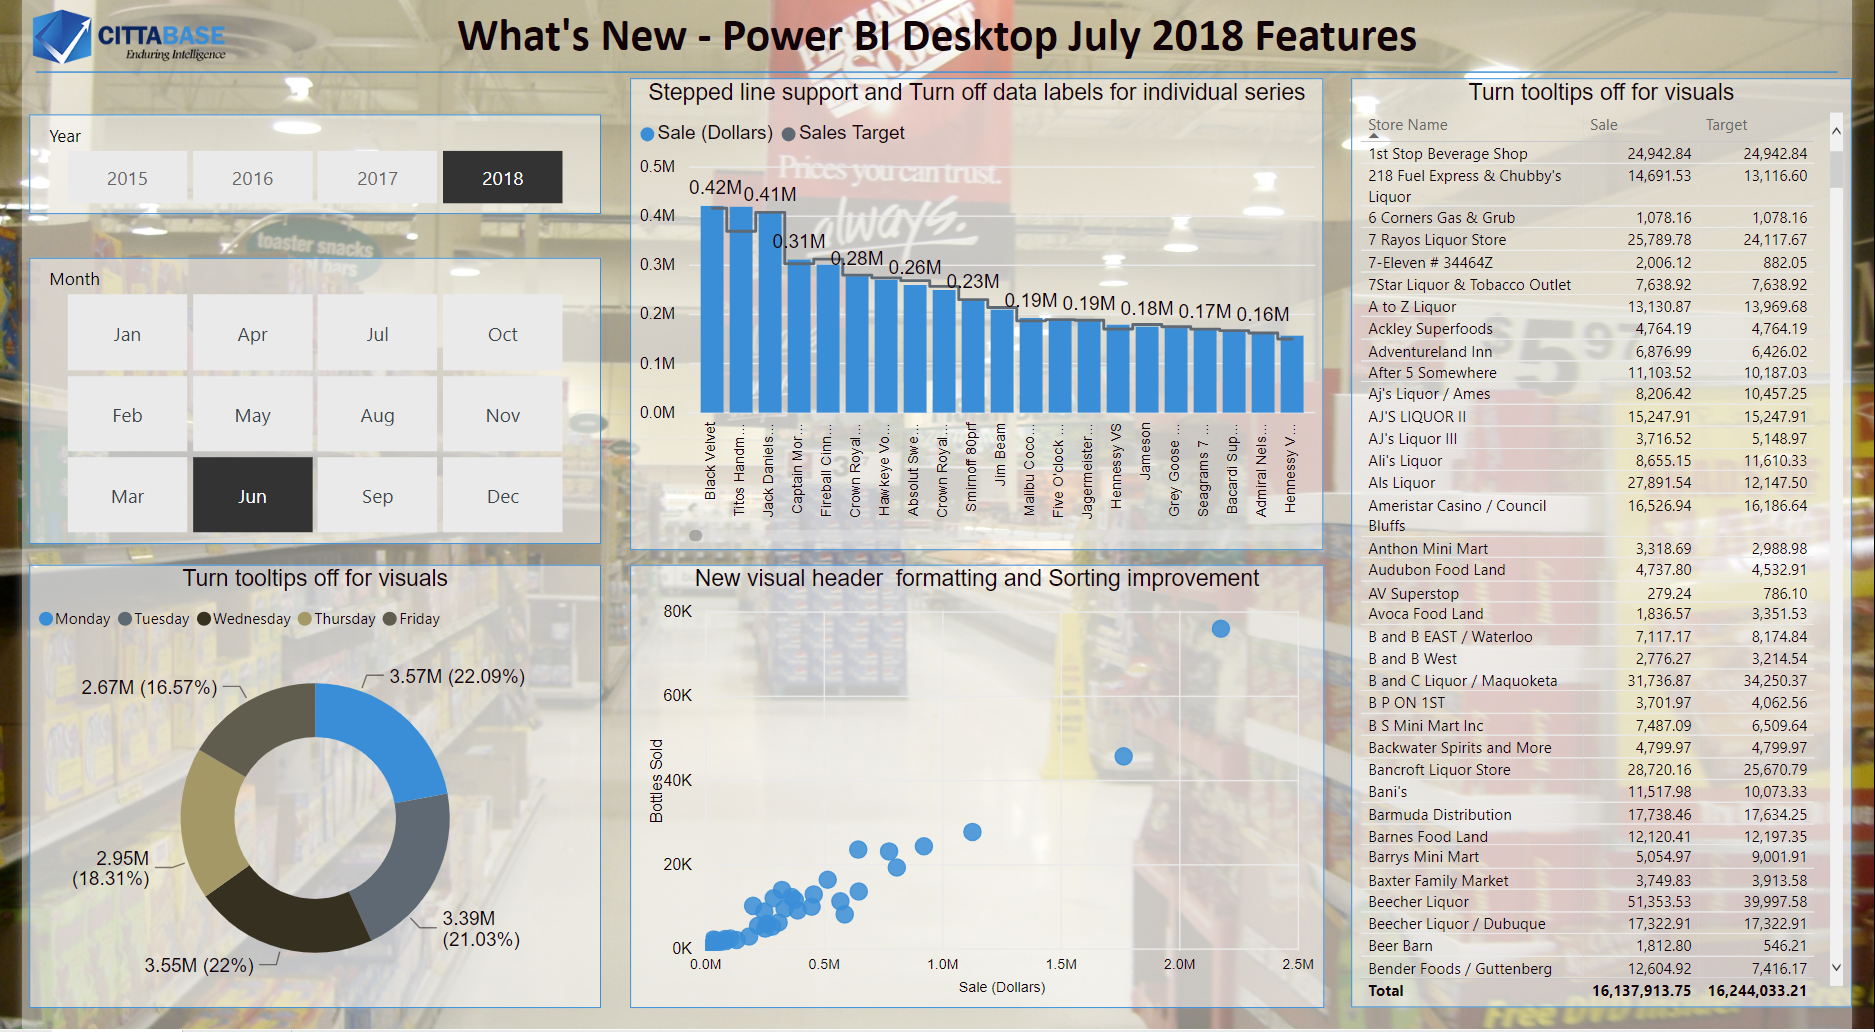
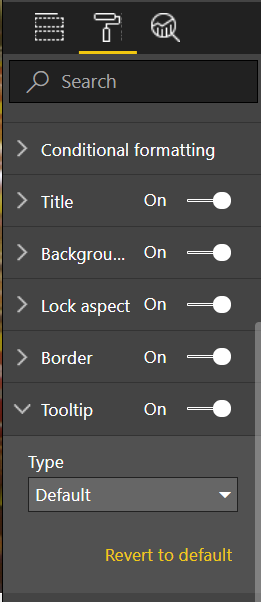
- Turn tooltips off for visuals:
In a few cases, you don’t need tooltips. The data labels and detail labels will be more effective then tooltip in that case. The purpose of the tooltip is getting the information of an item without click that item. In the below example, the detail label gave the information about each slice of the Donut chart,
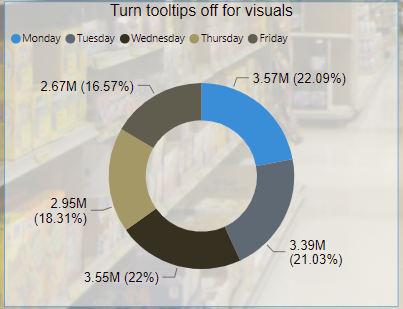
Here you don’t need the tooltip. You can turn off the tooltip using this feature for a particular visual.
- Slicer accessibility:
This feature allows you to access and play around the slicer using Keyboard shortcuts. Here are the keyboard shortcuts to access slicer,
- Ctrl + Right arrow – To enter into the slicer
- Tab – to move between options
- Space – Select a value
- Ctrl + Space – Select multiple Values
- Formatting pane improvements:
There are few improvements on Format pane. Here are they,
- A lighter grey color used inside cards
- Animations and hover effects
- Titles show above a given control to improve readability and reduce truncation
- Stepped line support for line and combo charts:
The stepped line feature is one the valuable feature of the month. It is more effective than the normal line. It will show the ups and downs of the matric. You can find the Stepped option under Shape in Format pane
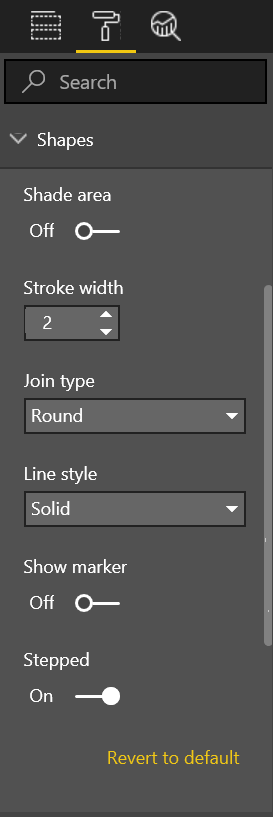
The below image shows you the importance of the stepped line,
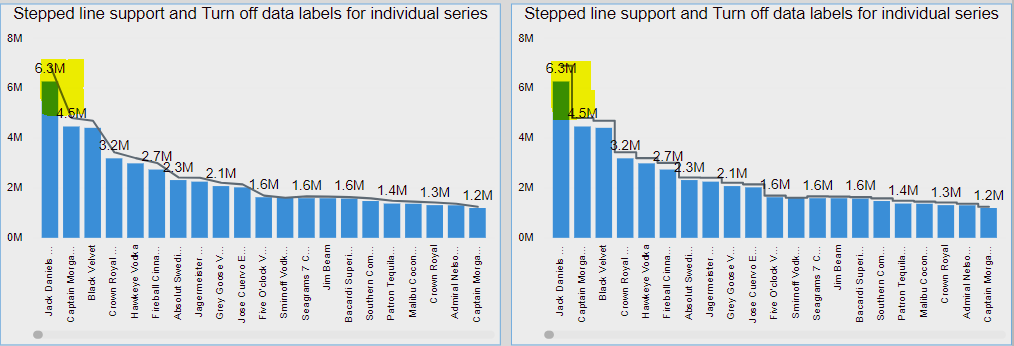
The difference (highlighted in yellow), in the first image that only connecting the points. In the second image, it shows how much the value differs from the previous value which shows exactly
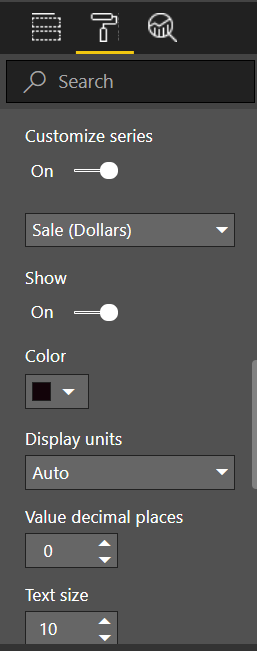
- Turn off combo chart data labels for individual series:
This feature allows to turn off the data label of individual series in Combo charts. Last month Power BI release a feature that allows you to customize the line and column data labels separately. You can find the Customize series option under Data Labels in Format pane
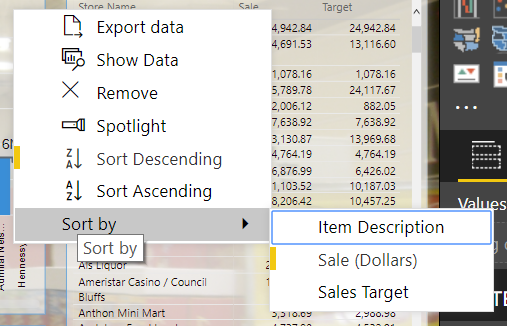
- Sorting experience improvement:
Earlier, You have separate Sort By option for every field used in the visual and also at times changing sorting order was a bit confusing. You have to click on right place to do the sorting. It wasn’t clear.
With this update, you can find separate options for change sorting direction and pick the field to sort by. It is easy to use.
Analytics
- Distribution factor insights:
The Distribution factor insights is a new type of insight. You can use this option by right clicking on Bar/Column of any type of Bar/Column charts.
It will run Machine learning and AI algorithms on the data which is used in the visual. It will show the insights in a visual with filter options.
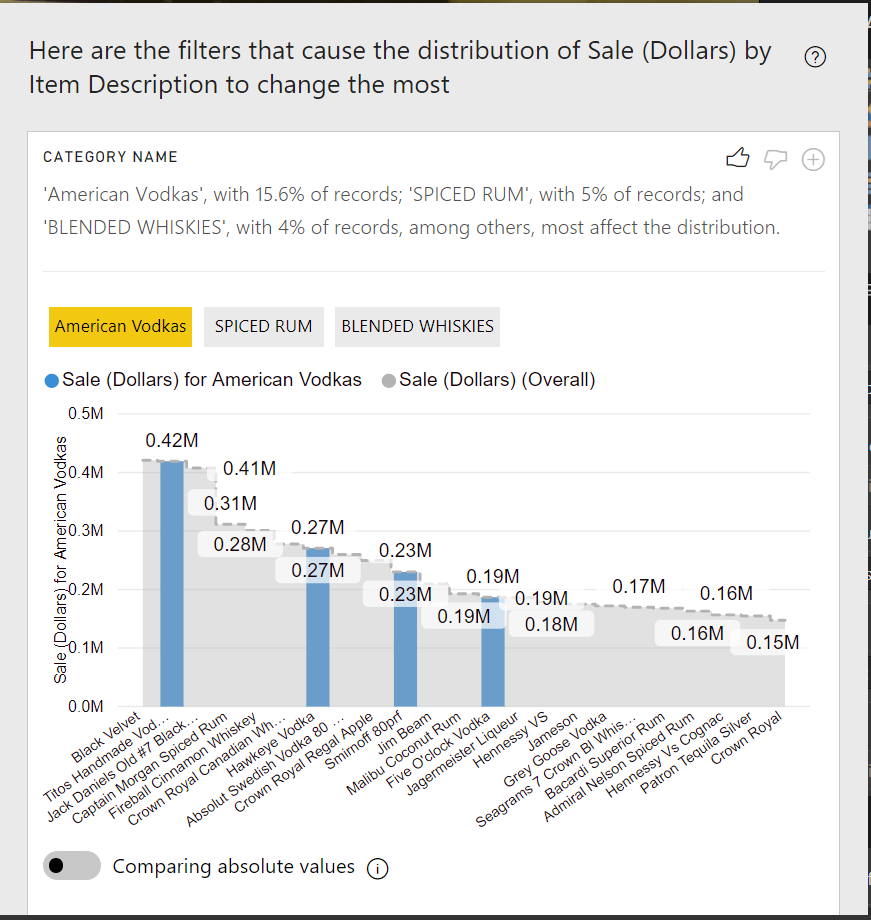
You can add this visual to the page. The toggle at the bottom allows toggle between viewing the graph as proportions – using a dual axis, or as absolute values – using a shared axis for both values.
Here is our sample report which covers the Power BI desktop July 2018 reporting features. You can play around with our report for the better understanding of the features. What’s New on Power BI Desktop – July 2018 Features
We hope that this blog helps you to understand about the Power BI desktop July 2018 features. Please do let us know if have any question or need further details here.
1 Comment
Comments are closed.
[…] The latest update of Power BI released on 6th of August 2018. This month’s update has a couple of exciting features. Python integration (preview) and Export PDF features are our favorite of the month. This blog will help you to get more details about the features and how to use them. Check out previous month features, What’s new on Power BI Desktop – July 2018 Features […]