
- August 16, 2018
- Posted by: Siva Mani
- Category: Power BI
The latest update of Power BI released on 6th of August 2018. This month’s update has a couple of exciting features. Python integration (preview) and Export PDF features are our favorite of the month. This blog will help you to get more details about the features and how to use them. Please do check out previous month features in case if you missed it – What’s new on Power BI Desktop – July 2018 Features.
Here is the feature list of Power BI desktop August update,
Custom visuals
The following new custom visuals now available in the appsource. You can get the visuals from there.
- 3AG Systems – Column Chart with Variance
- Scatter Chart by Akvelon
- Small Multiples Line Chart
- Add Natural Language Summaries for BI
- Pivot Slicer
Data connectivity
- Spark connector – It is now generally available.
Let’s see the reporting, analytics and modeling features in detail.
Reporting
Here are the reporting features of Power BI desktop August update,
- Print reports through Export to PDF
This is one of our favorite features of the month. Earlier we don’t have any option to export the report to PDF. This feature is available in Power BI desktop. You can find the option File -> Export to PDF.
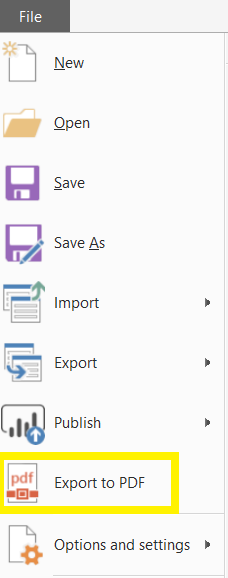
Once you select Export to PDF, Power BI desktop will start exporting the report. It will show you dialogue that letting you know the progress. The hidden pages will not be exported.
Limitations as of now:
- It is not available Power BI service. You can use the normal print option to export the report to PDF.
- Wallpaper formatting(color/images) won’t be exported. Only Page level formatting such as page background and images support in this future.
- Create bookmark groups
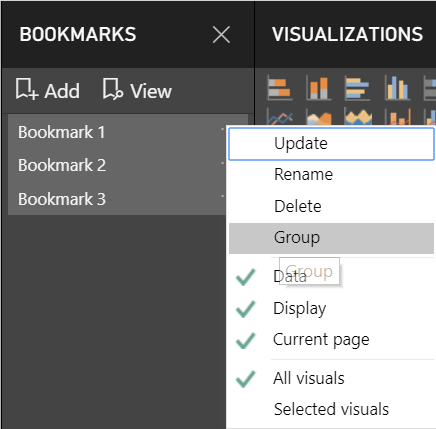
The bookmark feature is a wonderful feature and it is giving multiple options to attain different UI functionalities. With this new feature, you can create bookmark groups based on its purpose such as Navigation, Toggle measures/visuals. You can create a bookmark group using the Group option available in the bookmark menu. Click on the bookmark or Ctrl + click on bookmarks for multiple selections and select “…” for bookmark menu. You can find the Group option and select to create a bookmark group.
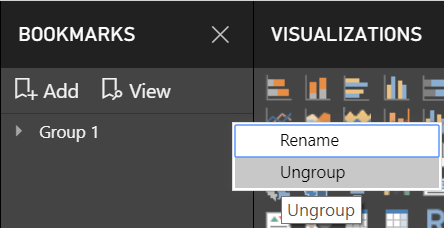
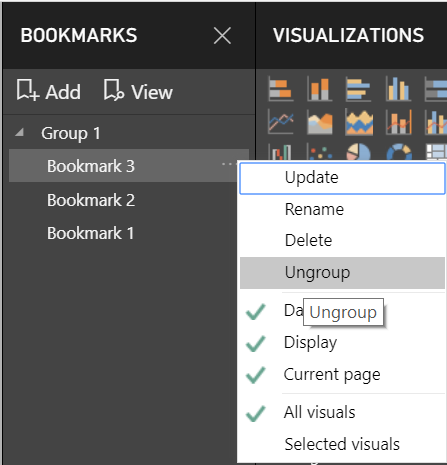
To ungroup the Bookmarks, Select the “…” menu for the group. You can find the Ungroup option. Select the option to ungroup the bookmarks which are available under that group. You can select the “…” for one bookmark to remove from the bookmark group.
When you use View option to play a bookmark group, you can see only the bookmarks available under that group. You can use View at the root level to play all the available bookmarks.
- Theming
Reporting theming is now generally available. It was first released as a preview feature on Mar 2017. You don’t have to enable it in the preview features pane anymore.
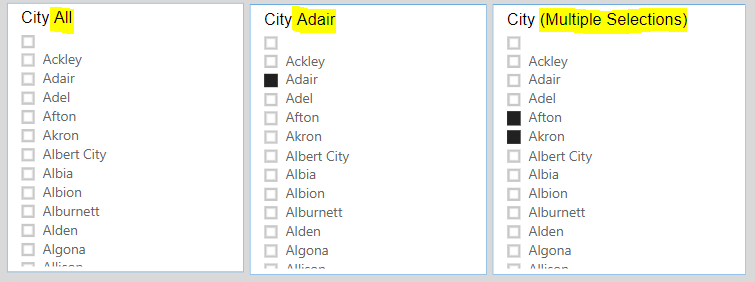
- Slicer restatement
Slicer restatement now available for List slicer. It is similar one which is available in the dropdown slicer. It will show you selected item on the top (in the header). It will show Multiple selections if you make more than one selection and it will show All by default or if you don’t make any selection.
Analytics
Here are the Analytics features of Power BI desktop August update,
- Conditional formatting by values
It is an enhancement of conditional formatting. The conditional formatting by field value will allow you to use a measure or a column that specifies a color. The value will be either a hex code or color name and it applies that color to the background or font color. The below gif will help you to do that,
With this feature, you can create dynamic colors for Conditional formatting based on your business logic using DAX. So, you don’t need to create many rules in the conditional formatting dialogue.
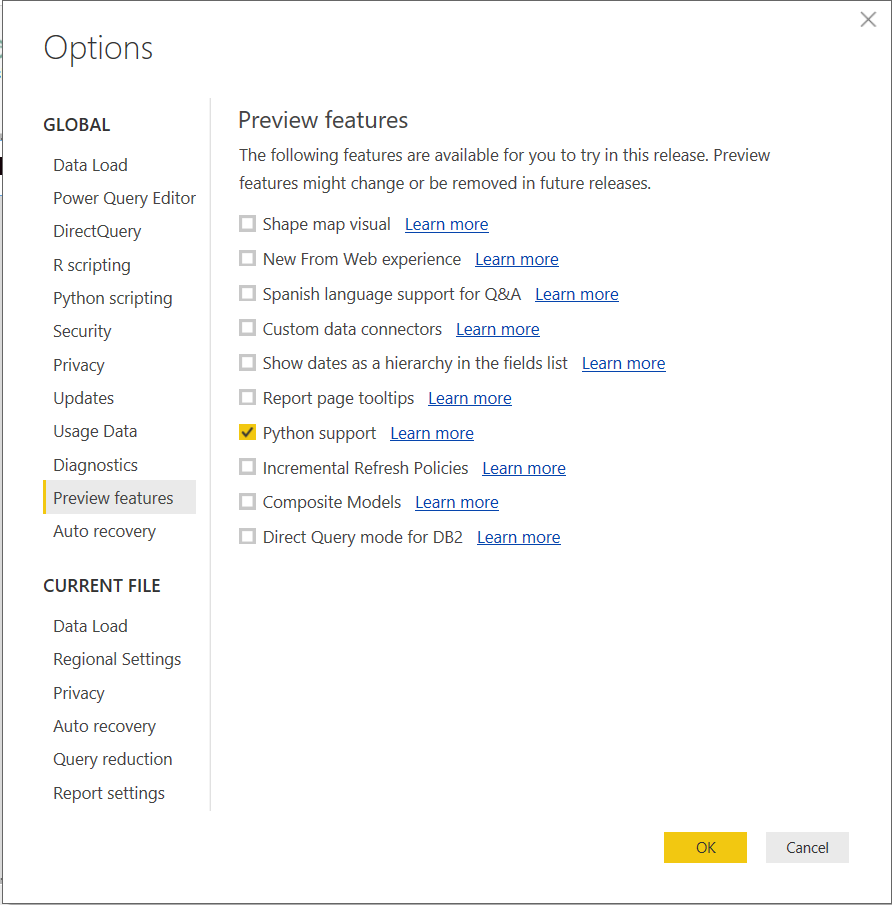
- Python integration (preview)
This is the most exciting feature in this month Power BI desktop update. We already have an option for R integration in Power BI desktop. You can enable this feature in File -> Options and settings -> Options -> Preview features.
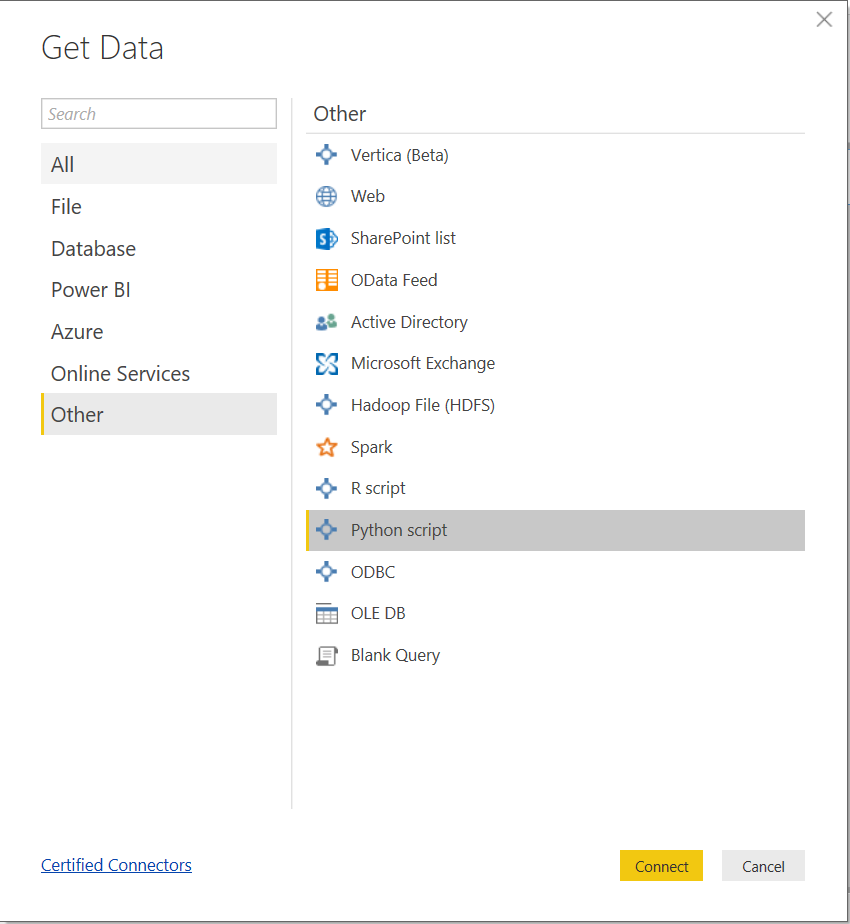
The Python connector is available under Get Data -> Other. You can create a data model using the connector and the Python script will run directly in Power BI Desktop.
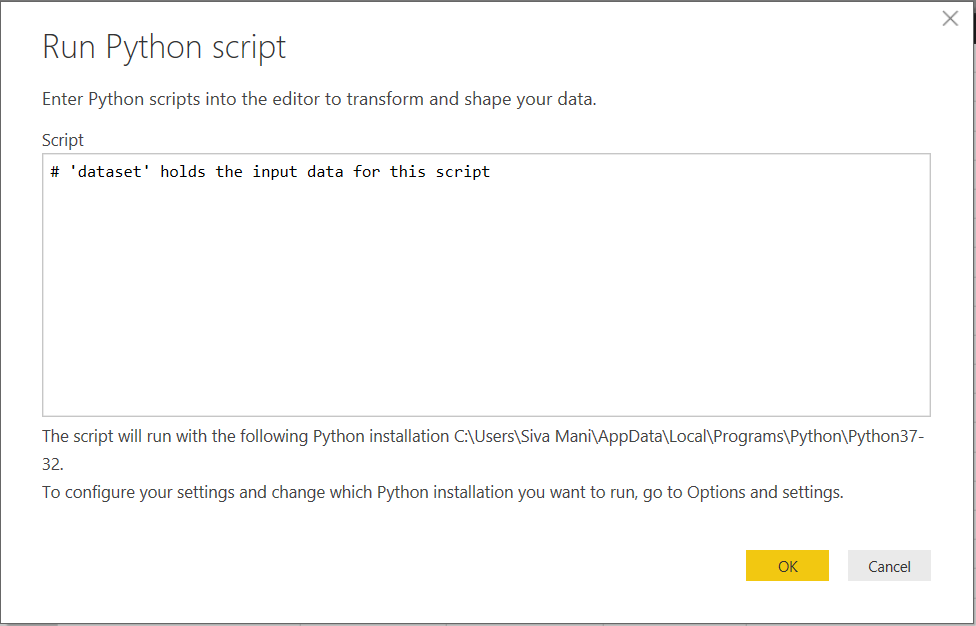
You can also use the Run Python script option for Advance data cleansing and data shaping.
Another option is, you can use python create visuals (similar to R script visual) by using Python visual.
- Q&A improvements
- Q&A in Power BI Desktop generally available
- Better matching experience for Power BI Desktop and Power BI Premium
Modeling
- Data categories for measures
You can specify the data category for a column or a measure. Power BI knows that how the values should be treated when you visualize it. In Power BI August 2018 update, there are two more data categories added.
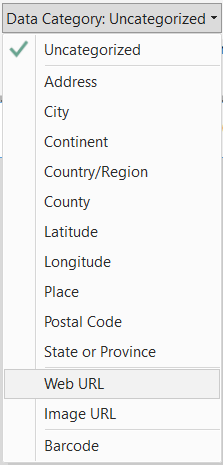
Web URL:
You can create a measure to generate dynamically URLs and mark the data category as a Web URL. You can use this feature for navigating to other Power BI reports. You can link other Power BI reports. You can pass values to filter other reports by using URL filter parameters.
Image URL:
This is a great feature. You can create a measure to create shapes, sparklines dynamically using SVG images. For more details, Use SVG images in Power BI.
- Statistical DAX functions
There are several new functions added to expand the statistical capabilities of DAX. Here are the new functions,
- DIST
- S.DIST
- INV
- S.INV
- DIST
- DIST.RT
- DIST.2
- INV
- INV.2T
We hope that this blog helps you to understand about the Power BI desktop August 2018 features. Please do let us know if have any question or need to know more about a specific feature.
4 Comments
Comments are closed.
[…] Image URL is a new feature released with Power BI Desktop update on Aug 2018. Please do check out other features details here. […]
[…] URL is a new feature released with Power BI Desktop update on Aug 2018. Please do check out this blog for Power BI Desktop August features […]
[…] The latest Power BI desktop features announced with the September update. This month update comes with amazing features. Aggregations, M intelligence and PDF file connector are some of them. This blog will help you to get more detail and how to use the features. Please do check out previous month features in case if you missed it – What’s new on Power BI Desktop – August 2018 Features. […]
[…] The latest Power BI desktop features released with the September 2018 update. This month update comes with amazing features. Aggregations, M intelligence, and PDF file connector are some of them. This blog will help you to get more detail and how to use the features. Please do check out previous month features in case if you missed it – What’s new on Power BI Desktop – August 2018 Features. […]