- July 10, 2024
- Posted by: Arvind Nagarajan
- Categories:
In today’s data-driven world, mastering data engineering skills is essential for extracting insights and value from vast amounts of data. PySpark, the Python API for Apache Spark, provides powerful tools for data engineering tasks, enabling developers and data engineers to efficiently process and analyze large-scale datasets. In this comprehensive guide, we’ll walk through an end-to-end data engineering example using PySpark, covering data ingestion, transformation, analysis, and visualization.
Prerequisites:
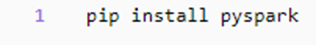
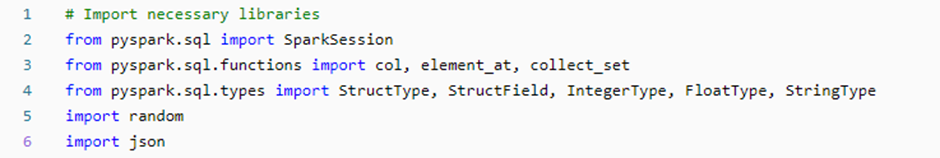
Before diving into the example, ensure you have Python and PySpark installed on your machine. You can install PySpark using pip and import all necessary libraries:
Example Scenario:
Imagine we have a dataset containing sales transactions from an e-commerce platform. Our goal is to perform various data engineering tasks on this dataset, including data ingestion, cleaning, aggregation, joining, analysis and visualization.
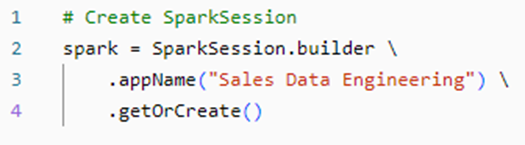
Step 1: Data Ingestion:
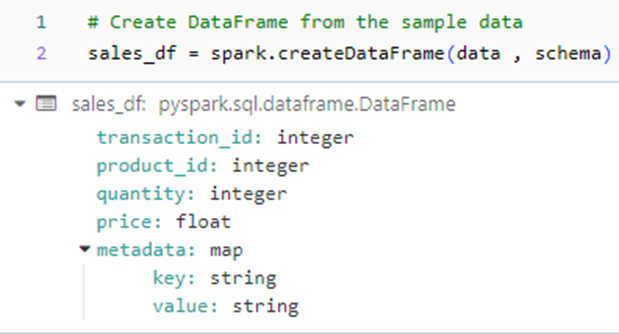
We begin by creating a SparkSession object and define the schema for our sample table sales_data. We the proceed to ingest the sales data into a PySpark DataFrame. Let’s create a sample DataFrame named sales_data with 100 rows and 5 columns: transaction_id, product_id, quantity, price, and timestamp.
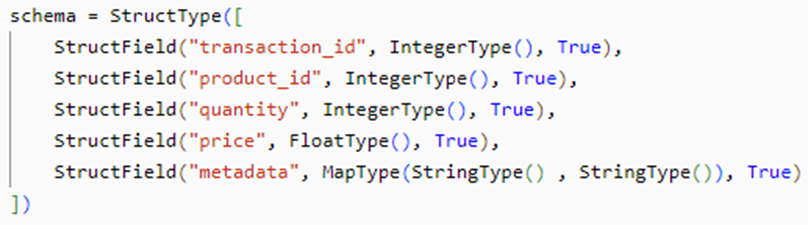
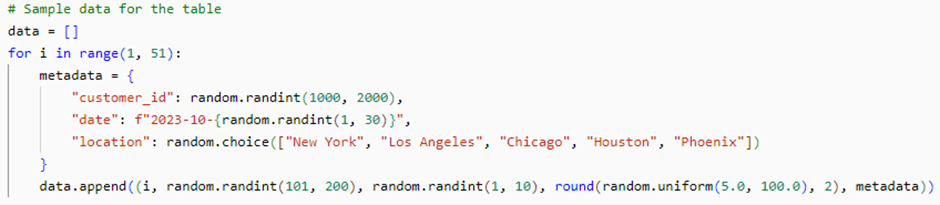
In this step, we create a sample DataFrame named sales_df with 100 rows and 5 columns. We define a schema for the DataFrame specifying the data types of each column, and then manually create sample data for the table.
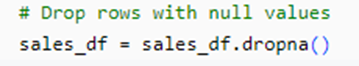
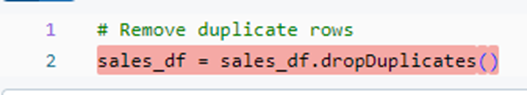
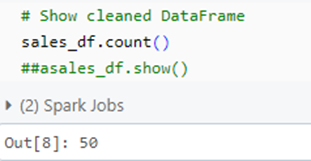
Step 2: Data Cleaning:
Next, we clean the data by removing any null values and duplicate rows.
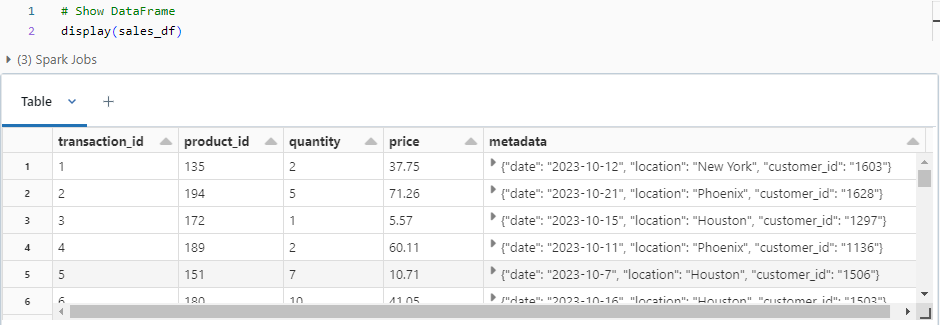
Let’s start by exploring the dataset. Apart from direct data, we have a column that contains JSON data. The next step will be to unpack the JSON value and spilt it to different columns.
Step 3: Process JSON data:
As we have already defined a schema (see step 1) with a MapType for the metadata column to properly store JSON objects. We now unpack the JSON objects using the element_at function.
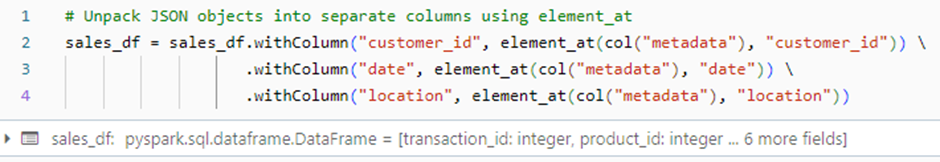
The element_at function in PySpark is used to retrieve an element from an array or a value from a map at a specified index or key.
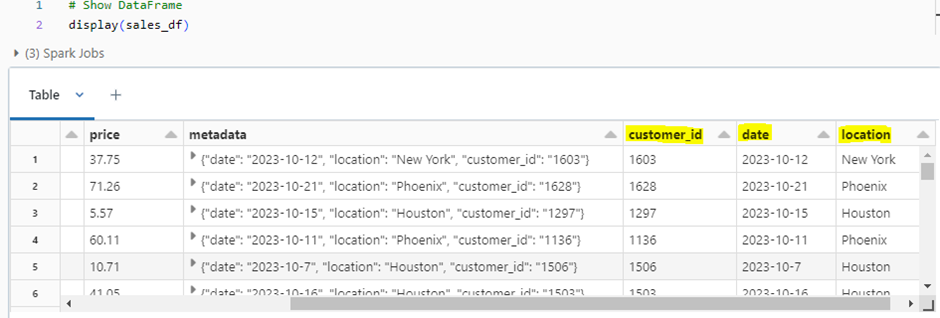
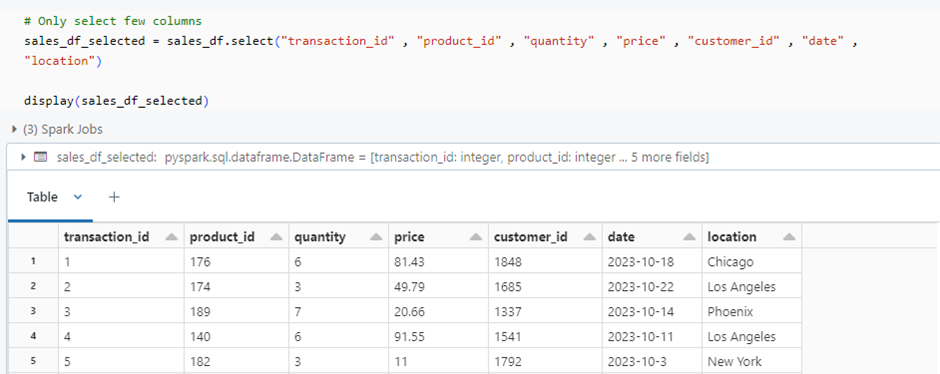
On checking the dataframe again, we can see the required columns are unpacked. Next, we will just bring in only the necessary columns.
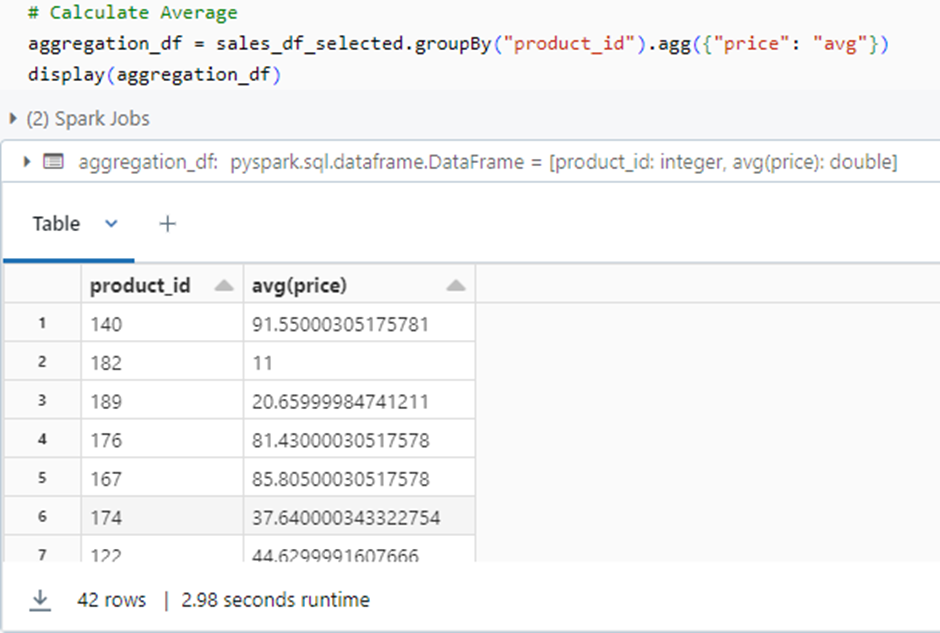
Step 4 : Data Aggregation
Let’s perform an aggregation operation on our dataset. For example, let’s calculate the average price by product_id:
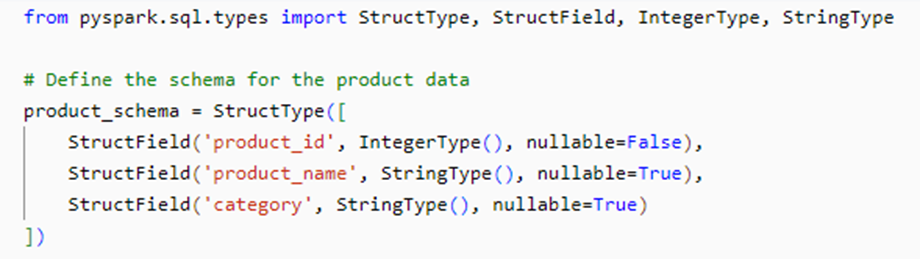
Step 5: Joining additional data:
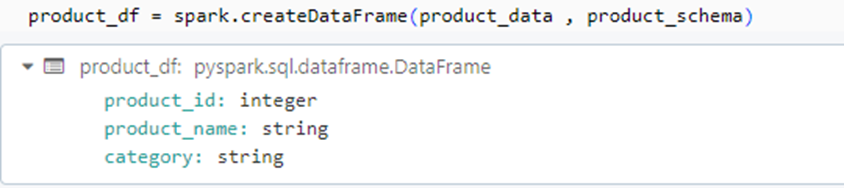
Next, we create a product table with a common key for joining. We will define the schema and create the DataFrame.
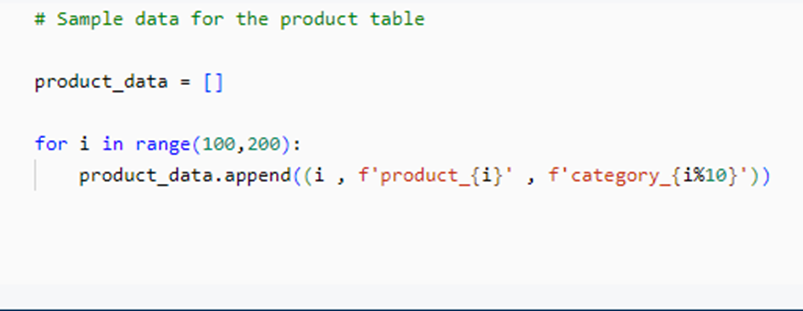
Lets create a dataframe for the newly created data using the respective schema.
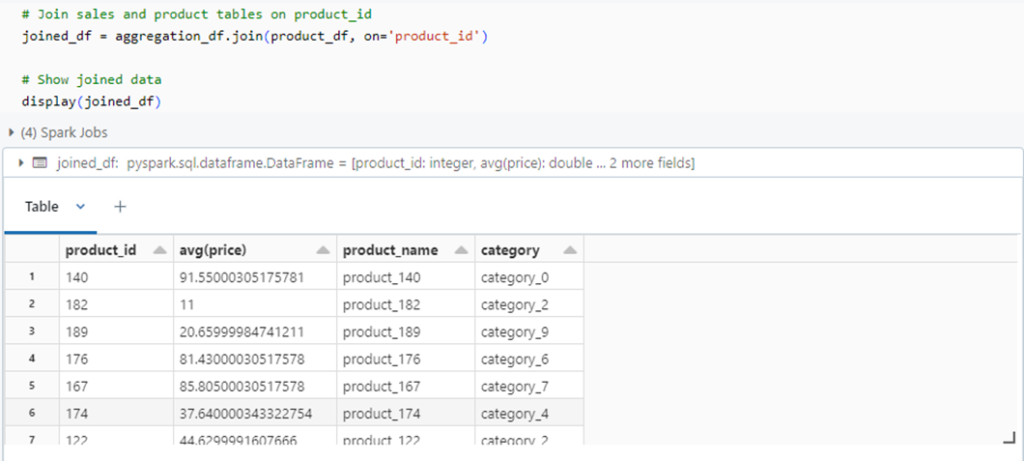
Now, we can join the sales and product tables with product id as common key.
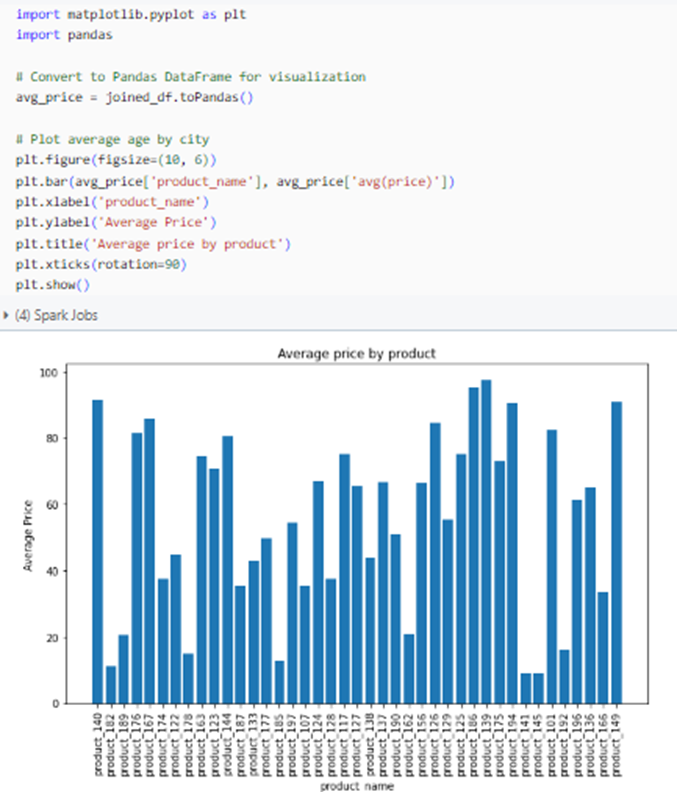
Step 6: Data Visualization:
Finally, we can visualize our data using various plotting libraries such as Matplotlib or Seaborn. Let’s visualize the average price by product_id:
Conclusion:
In this blog post, we’ve covered an end-to-end data engineering process using PySpark. We started by ingesting data, performed exploration, cleaning, and transformation operations, processed JSON data, conducted aggregation, visualized the data, and joined additional datasets. PySpark’s flexibility and scalability make it an excellent choice for handling large-scale data processing tasks efficiently.