
- December 6, 2020
- Posted by: Syed Absar
- Categories: Analytics, Power BI, Tableau
Reporting tools is a self-contained program with an interface that helps the user accomplish reporting tasks. It typically consists of one or more Master Files and procedures. The Master Files interpret the data sources that are accessed, while procedures define how that data is retrieved and displayed.
Web based application like Inventory Management , Order Management , CRM , HRM, etc. can have their own developed reporting module page to see the insights of the application data . But, They do have certain limitations when it comes to reporting.
The best way to develop interactive reports from application data is hitting directly to the localhost database maintained by XAMPP
Follow below steps to connect the local database from PhpMyAdmin Portal
Step 1 :
Open XAMMP and start the module’s Apache and MySQL.
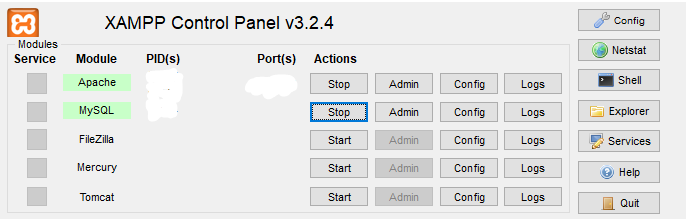
click ‘Start‘
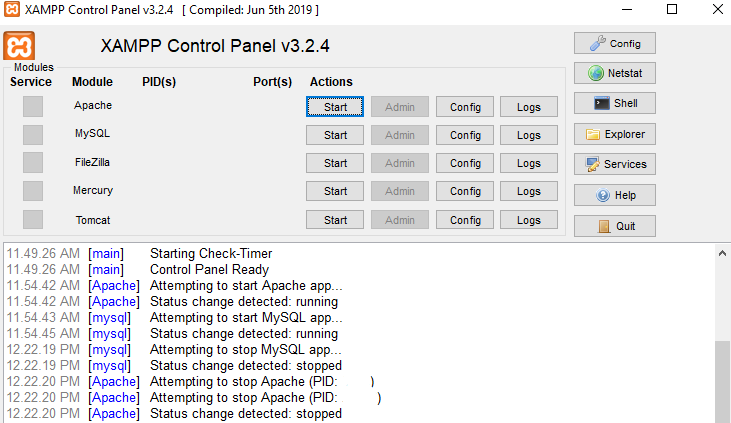
Service is running ,
Step 2 :
Open phpMyAdmin portal just to make sure the services is append running.
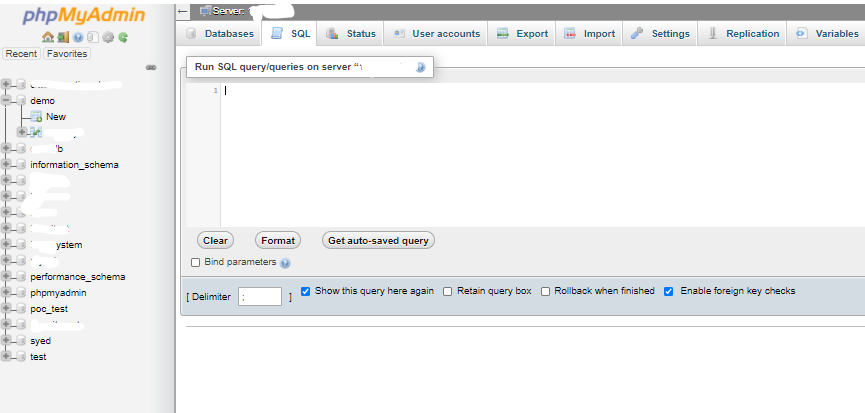
Now, here comes the interesting part connecting to Tableau Desktop and Power Bi Desktop for reporting.
Step 3 :
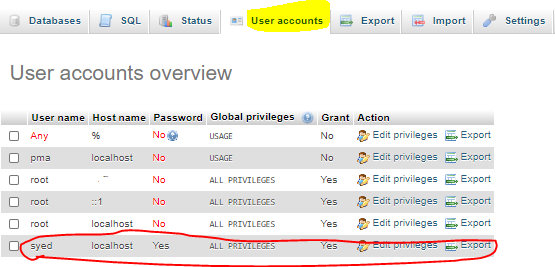
Follow the credentials to configure the database connection in reporting tools.
The default connection strings are :
(‘Server Name‘, ‘localhost’)
(‘User Name‘, ‘root’)
(‘Password‘, ”)
If you have any specific user account , enter user name and password instead of default user name ‘root‘
To connect in tableau desktop :
Open Tableau Desktop –> Connect to the data source (MySQL) –> enter the credentials of your local host database , Pls refer the snapshot below
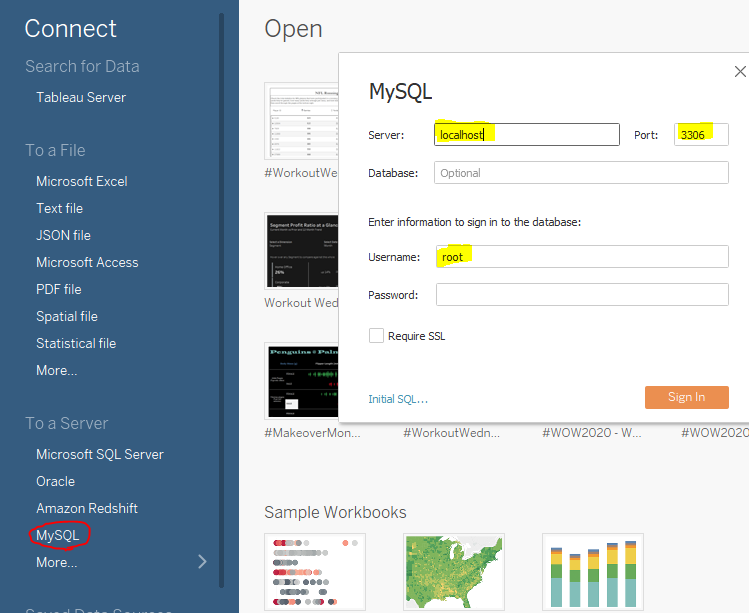
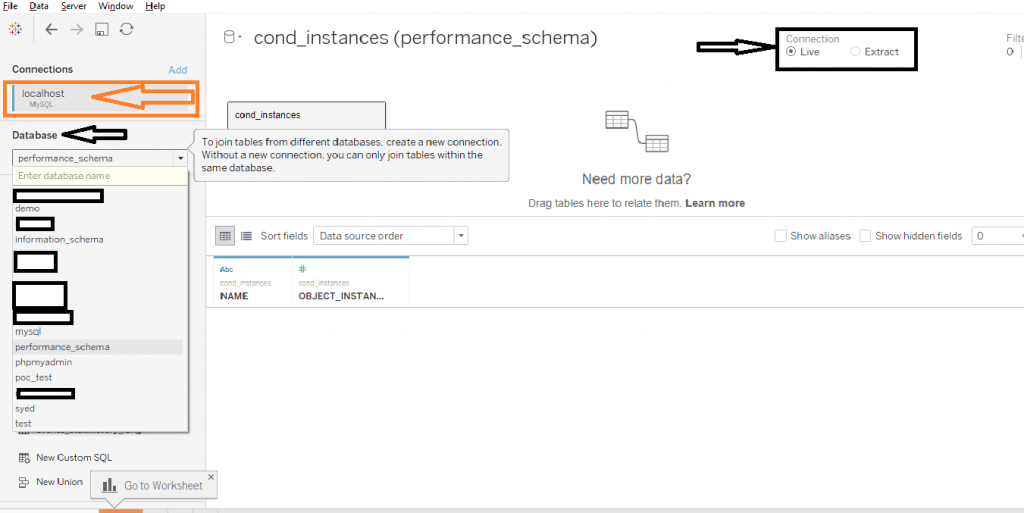
After entering the user name just click ‘Sign In‘ no need to enter password ,once your connection is validated , it will show the database details in data model pane from there you can start building your reports .
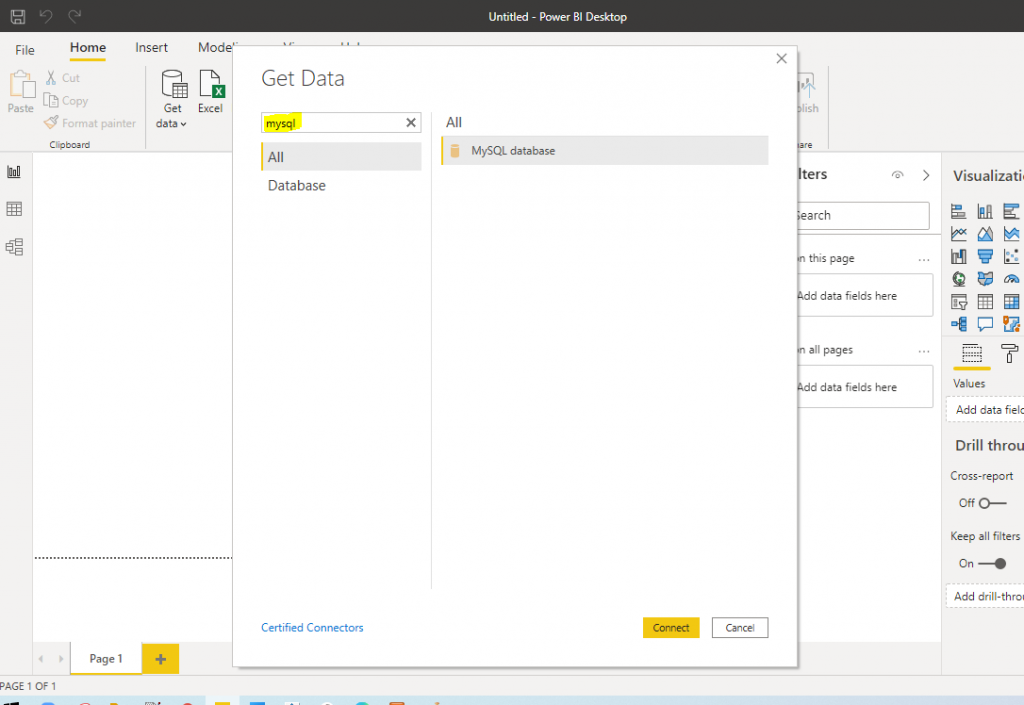
 To connect in power bi desktop :
Open Power BI Desktop –> Connect to the data source (MySQL)
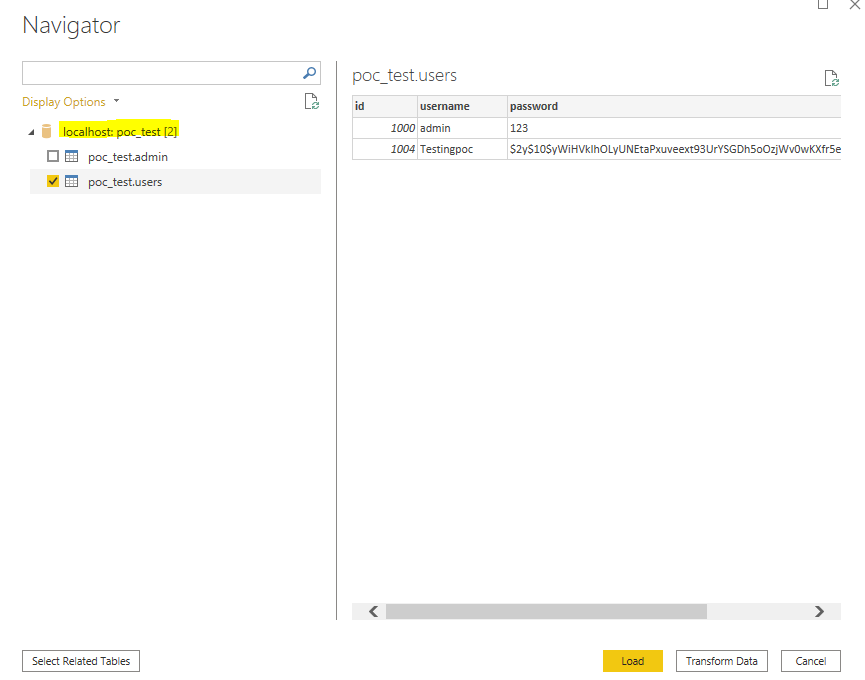
Enter the credentials of your local host database , Pls refer the snapshot below
Note : Database text box is mandatory field
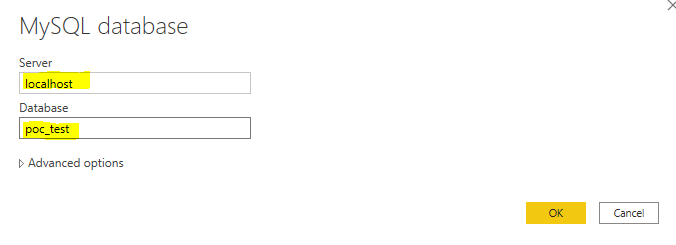
Add the tables and click ‘Load‘ and start building the reports and dashboards
After building the dashboards in both reporting tools , publish to their respective server then share your insights reports across same organization.
How do we automate these reports after publishing in tableau and power bi server ?
Coming up next stay tune..!
Please feel free to reach Cittabase for more information.
Click here to visit more blogs .