
Patient Condition Analytics: Data Integration, Analysis, and Prediction Using the KNIME Analytics Platform
- June 4, 2024
- Posted by: Alfred Romario
- Categories: AI/ML, Data Integration, Data Visualization, Healthcare Analytics, Snowflake
Knime Analytics Platform:
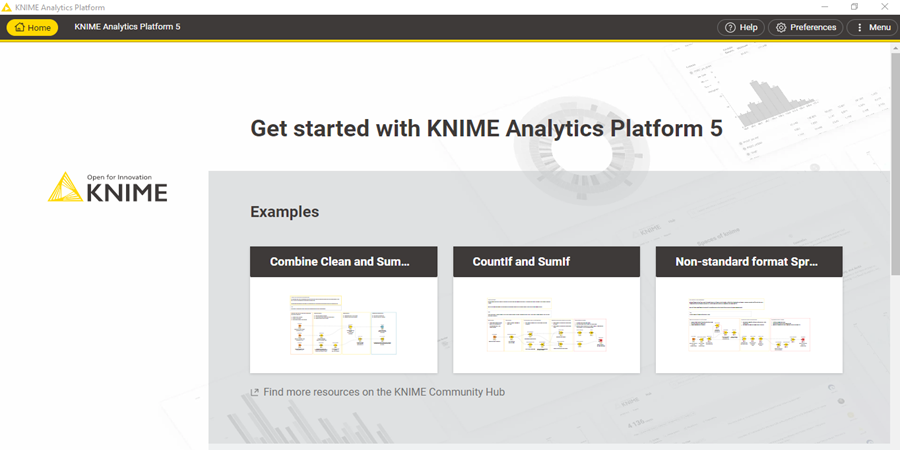
KNIME Analytics Platform is an open-source data analytics, reporting, and integration platform. KNIME, which stands for “Konstanz Information Miner,” allows users to visually create data workflows, from simple ETL (Extract, Transform, Load) tasks to more complex data analysis and machine learning processes. With KNIME, users can connect various data sources, perform data preprocessing tasks, apply machine learning algorithms, visualize data, and deploy models. It offers a user-friendly graphical interface where users can drag and drop nodes to create workflows without the need for coding.
KNIME Interface:
Workspaces:
The workspace is the directory on your system where all your workflows, data files, and configurations are stored. It provides an organized environment to manage and save your projects and associated resources. Within the workspace, you can create multiple workflows, which are visual representations of data processing pipelines, consisting of interconnected nodes. The workspace ensures that all components of your data analysis projects are easily accessible and manageable.
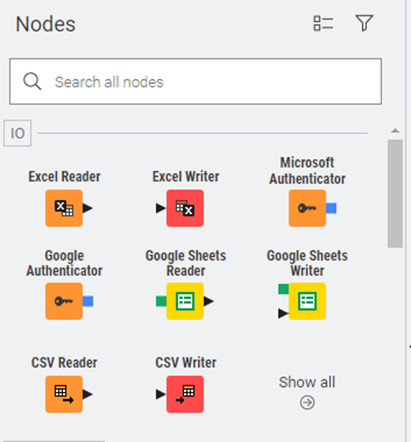
In KNIME, workflows are built using nodes, each of which performs a specific task.
·Data Access Nodes: These nodes are used to read data from various sources such as databases, spreadsheets, and files (e.g., CSV Reader, Excel Reader, Database Connector).
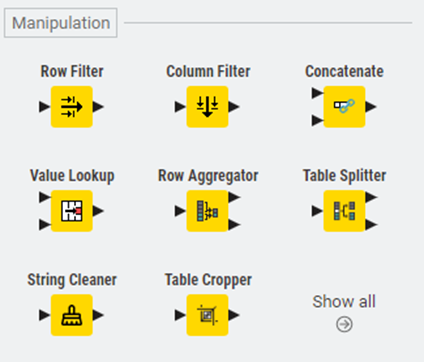
·Data Manipulation Nodes: These nodes handle tasks such as filtering, sorting, joining, and transforming data (e.g., Row Filter, GroupBy, Joiner, Column Filter).
·Data Transformation Nodes: These nodes transform data by changing its format or structure (e.g., String Manipulation, Pivoting, Unpivoting, Math Formula).
·Data Mining and Machine Learning Nodes: These nodes are used for building, training, and evaluating machine learning models (e.g., Decision Tree Learner, Logistic Regression, K-Means, Neural Network Learner).
·Text Processing Nodes: These nodes deal with text data, allowing for text mining and natural language processing tasks (e.g., String to Document, N-gram Creator, Document Vector).
·Visualization Nodes: These nodes create visual representations of data, such as charts and graphs (e.g., Scatter Plot, Line Plot, Bar Chart).
·Scripting and Automation Nodes: These nodes allow for custom scripting and automation of tasks using languages like Python and R (e.g., Python Script, R Snippet).
·Flow Control Nodes: These nodes manage the control flow of workflows, enabling conditional execution and looping (e.g., If Switch, Loop Start, Loop End).
·Statistics Nodes: These nodes perform statistical analyses and tests on data (e.g., Descriptive Statistics, Correlation, Chi-Square Test).
·Data Output Nodes: These nodes are used to write or export data to various formats and destinations (e.g., CSV Writer, Excel Writer, Database Writer).
Prediction and Analysis:
- Data is loaded into Knime, is cleaned, and is visualised via charts.
- The cleaned data is then written into snowflake dB using Knime and is later read into Knime and used to create a random forest model.
Data Analysis
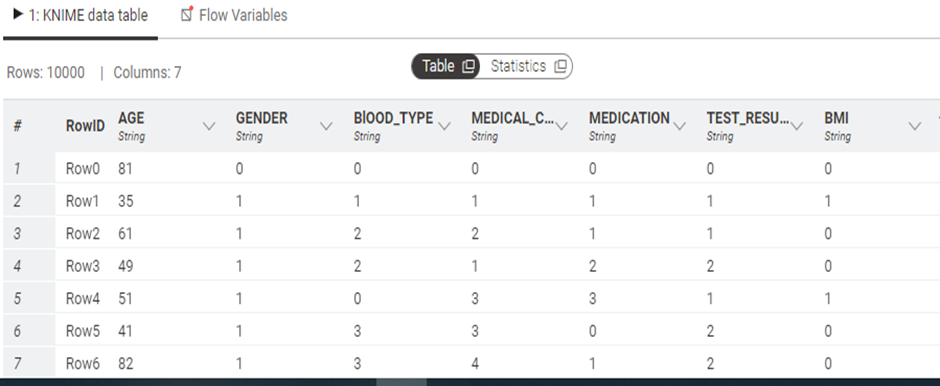
The data (.csv file) is loaded into the environment through a csv reader node.
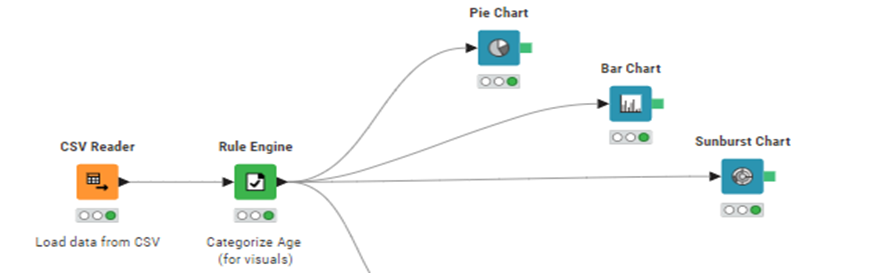
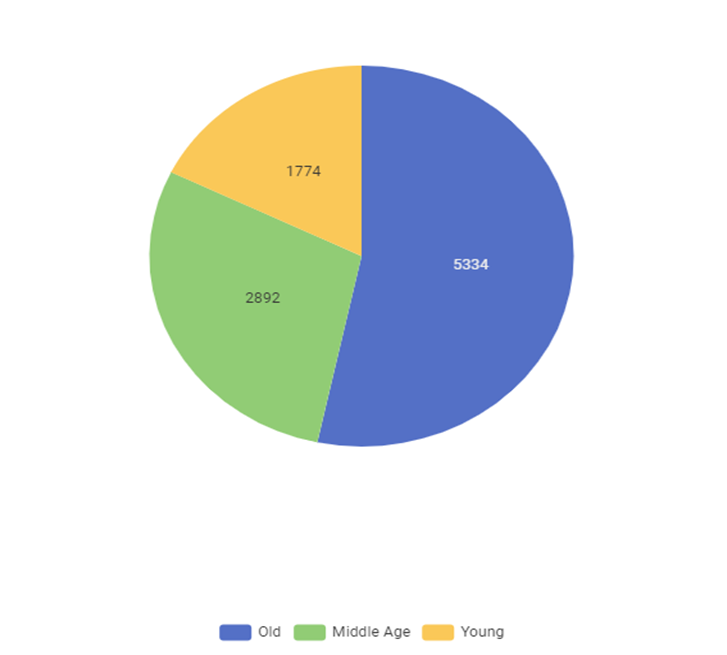
Pie Chart:
Distribution of the patients based on their age.
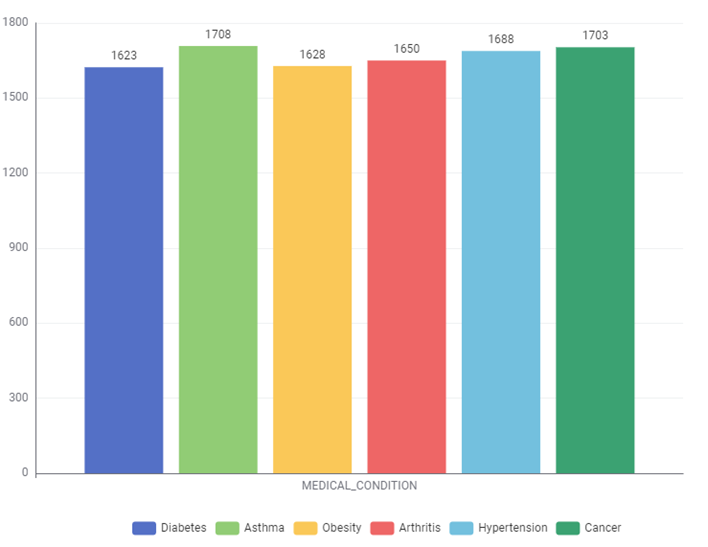
Bar chart:
Distribution of the patients based on Medical Condition.
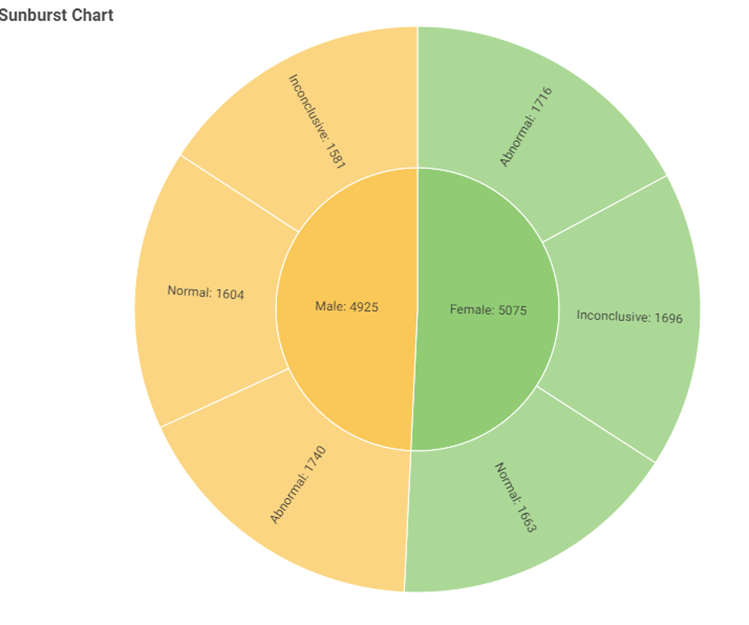
Sunburst Chart:
Distribution of the test results based on the gender.
Prediction – Model Building:
Unnecessary columns are removed from the data using column filter. With this only the required features for model building are taken.
The features are encoded using the number to string node.
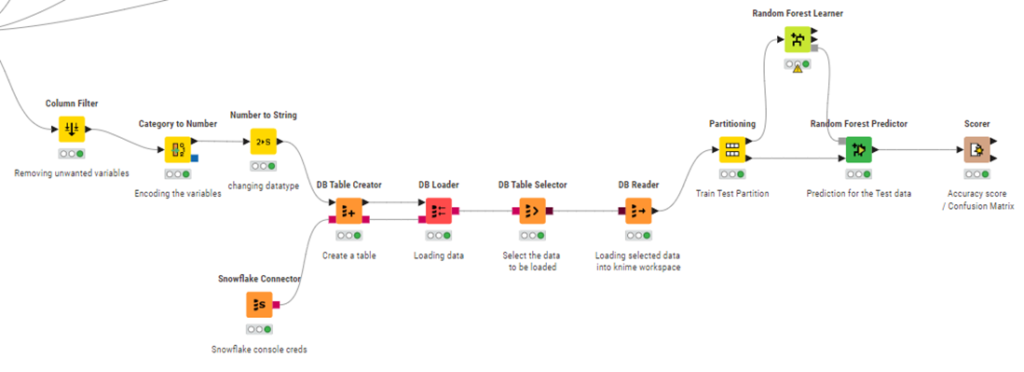
Getting data from Snowflake DB for model building:
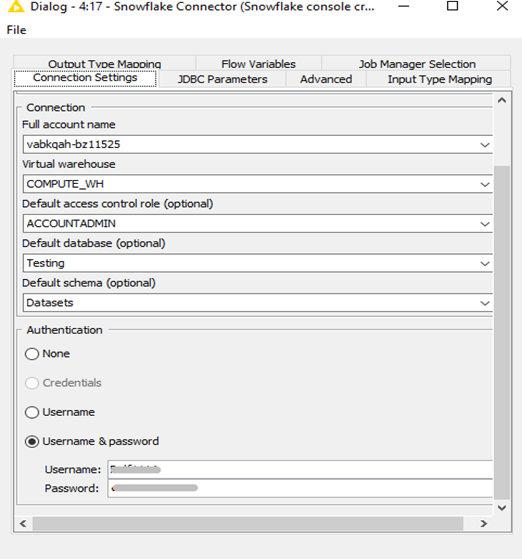
The cleaned data is pushed into the snowflake DB using the snowflake connector and DB Table creator nodes.
- Input the connection details to connect to your snowflake environment.
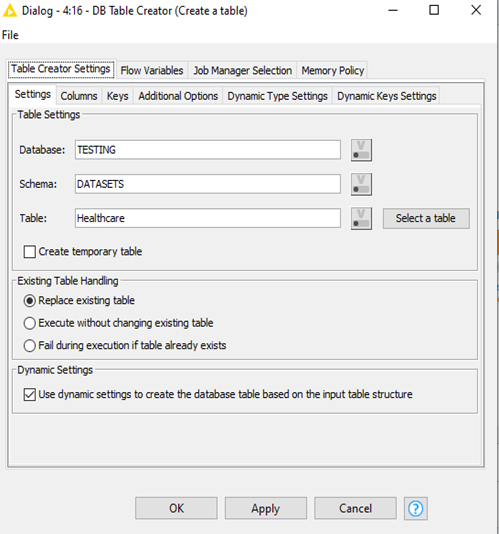
- Create a table using the DB Table Creator.
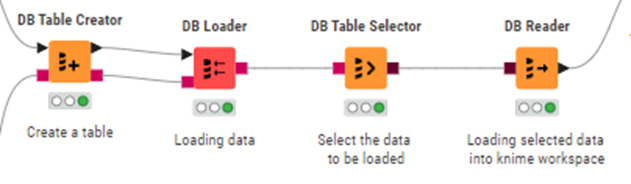
Data is loaded into Snowflake.
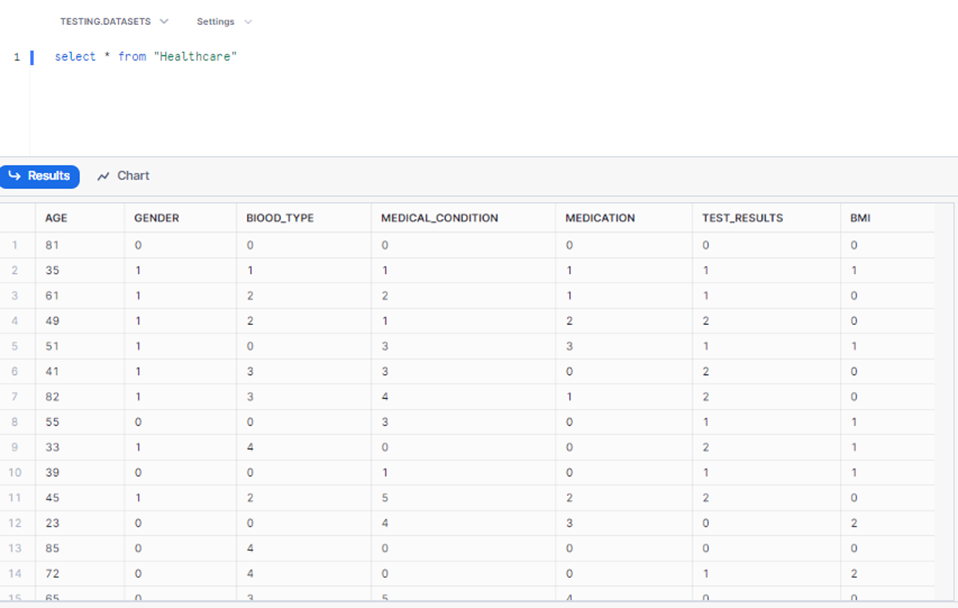
Load the data into snowflake, and the call the loaded data into KNIME workspace.
Building a model using the data loaded from snowflake.
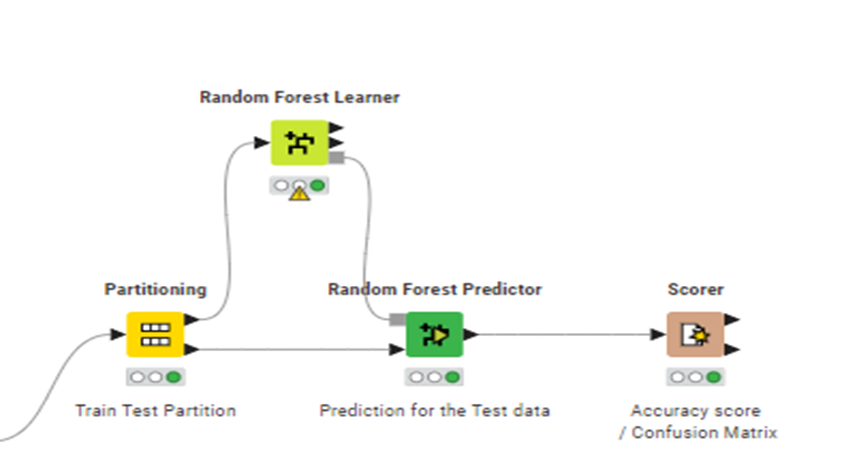
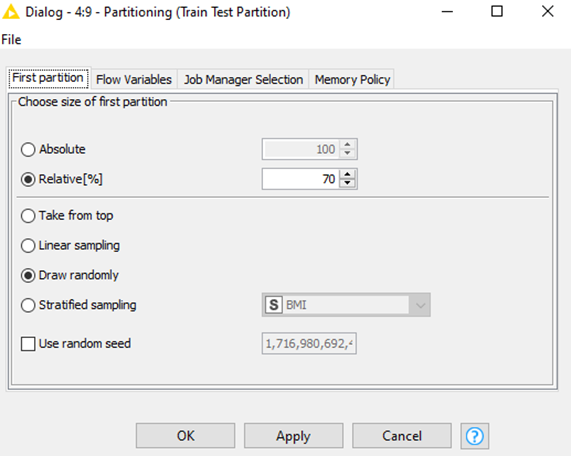
1.Split the data into train and test using Partitioning Node.
2. Train the data using Random Forest Learner and Predict the outputs using the Random Forest Predictor
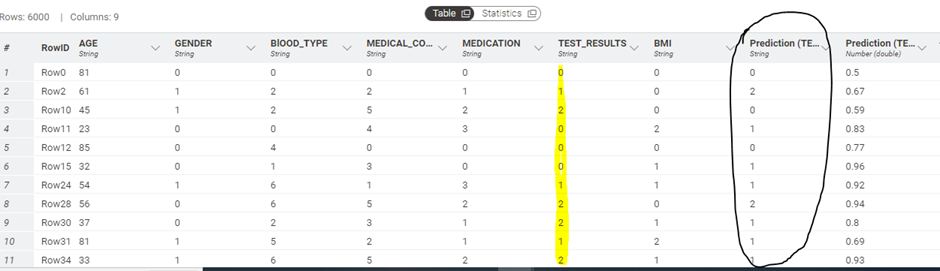
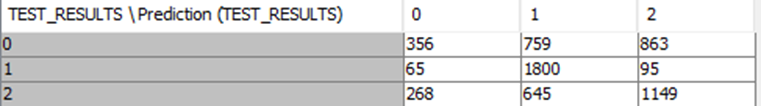
3. Check the accuracy and the correctly predicted values with the Accuracy stats and confusion matrix in Scorer node.

Conclusion:
In conclusion, the analytics and prediction model using the KNIME Analytics Platform effectively demonstrates a comprehensive data processing workflow. Initially, data is loaded from a CSV file into KNIME, where it undergoes thorough cleaning and analysis through visualizations. The cleaned data is then seamlessly loaded into Snowflake for efficient storage and management. Subsequently, the data is imported back into KNIME, where a Random Forest model is built, showcasing the platform’s capability to handle end-to-end data analytics and prediction tasks efficiently. This integrated approach ensures robust data handling, storage, and predictive modeling, enhancing the overall analytics process.