
- May 10, 2024
- Posted by: Alfred Romario
- Categories: AI/ML, Data Visualization, Healthcare Analytics, Streamlit

Understanding the dataset:
The dataset powering the Patient Condition Analysis Dashboard and Prediction originates from Kaggle. This dataset comprises patient’s test results (Patient’s condition), and the factors influencing it. It has 10000 records and 14 attributes essential for comprehensive patient analysis including:
Deciphering Medical Insights:
Analyzing test results is pivotal in healthcare as it provides critical insights into a patient’s condition, guiding diagnosis, and treatment decisions. By scrutinizing test results, healthcare professionals can identify anomalies, track disease progression, and adjust treatment plans accordingly. Moreover, it facilitates early detection of potential complications, enabling proactive intervention to improve patient outcomes and prevent adverse events.
Using Python and Streamlit to develop the App:
Harnessing the power of Python, we can unravel the intricacies of the dataset and glean actionable insights. Below are key snippets illustrating the analytical process:
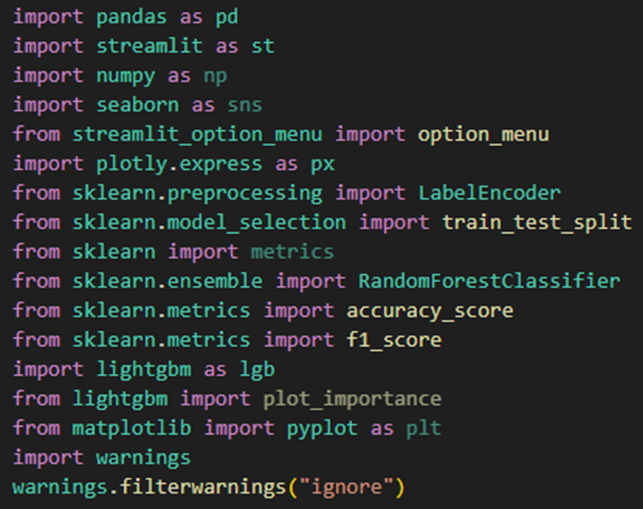
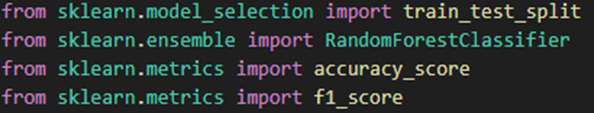
Importing required libraries:
Feature Engineering:
Augmenting the dataset with additional variables to facilitate in-depth analysis and model building.

Converting date_of_admission’ column to datetime format and extracts the year from it, storing it in a new column named ‘admit_year. This column helps us to gain insights across the year.
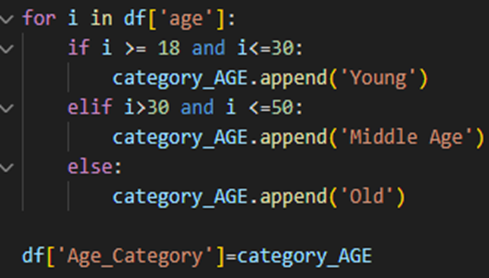
- Categorizing the age column into three categories. This is done to group the patients and understand the influence of age in the patient condition.
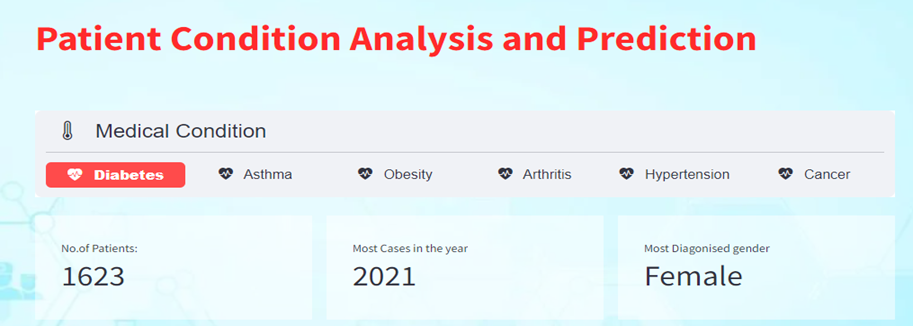
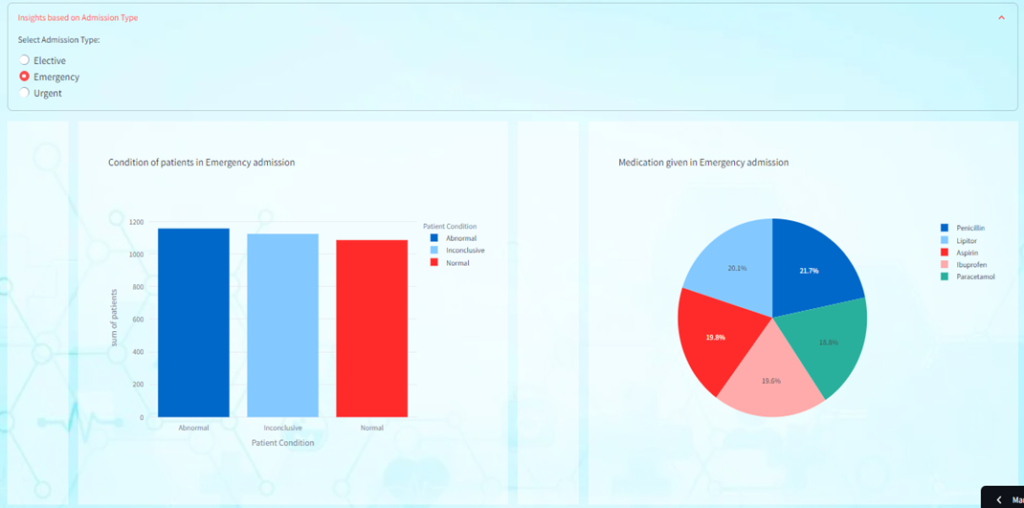
Creating Interactive Visuals and KPI
Utilizing streamlit components and Plotly to generate interactive visualizations for a deeper understanding of the dataset
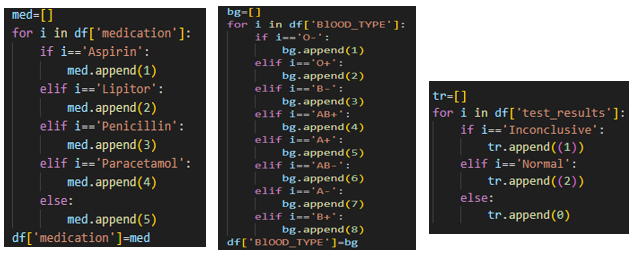
Encoding the features:
Transforming categorical variables into numerical format to prepare the data for modelling.

Removing Unnecessary Variables:
Streamlining the dataset by eliminating redundant or irrelevant variables.

For model building we use only 7 features – age, gender, blood type, medical condition, admission type, medication and BMI.
Building Predictive Models – Leveraging Random Forest and LightGBM:
Harnessing the power of machine learning, we can develop predictive models to anticipate patient outcomes based on their characteristics. Here, we’ll build two models – LightGBM and Random Forest – to predict patient conditions. These models utilize historical data to forecast potential medical outcomes, enabling healthcare professionals to make informed decisions and tailor treatment plans accordingly.
Note: While the models, visuals and the approach indicate the potential of the dashboard, the possibilities and its functionality, please note that by including additional data volume and expanding the set of features as available, the accuracy and other metrics can be further improved, making the model more robust.
Now, let’s take a closer look at the steps involved.
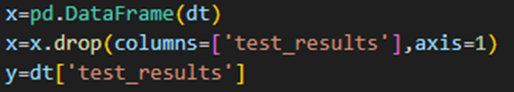
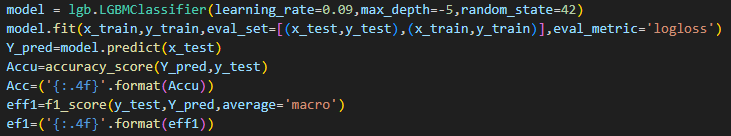
2. Assigning x and y: Identify your independent variables (features) and dependent variable (target) in your dataset. Assign them to variables X and y respectively. 3. X, Y Train-test split: Split your dataset into training and testing sets. This helps in evaluating the model’s performance on unseen data. Here, test_size =0.20 specifies that 20% of the data will be used for testing, and random_state=42 ensures reproducibility. 4. Fitting the Model – Accuracy and F1 Score:

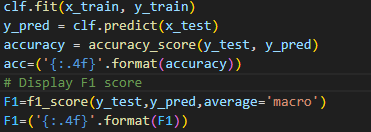
Train (fit) the model on the training data using the fit () method.
After fitting the model, evaluate its performance on the test data. One common metric is accuracy, which measures the proportion of correctly predicted instances.
Random Forest:
With a limited dataset, achieving high accuracy numbers can be challenging. However, by gathering more diverse data and adhering to the methods outlined in the blog, improved accuracy is attainable.
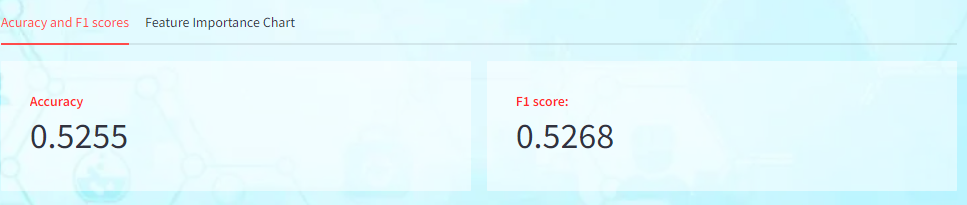
- Accuracy measures the proportion of correctly classified instances out of the total instances. Here the model achieves an accuracy of 52.5%, meaning that it correctly predicts the target variable for approximately 52.5% of the instances in the test set.
- F1 score is the harmonic mean of precision and recall and provides a balanced assessment of the model’s performance. A higher F1 score indicates better performance in terms of both precision and recall. In this case, the model achieves an F1 score of 0.5268, suggesting a reasonable balance between precision and recall.
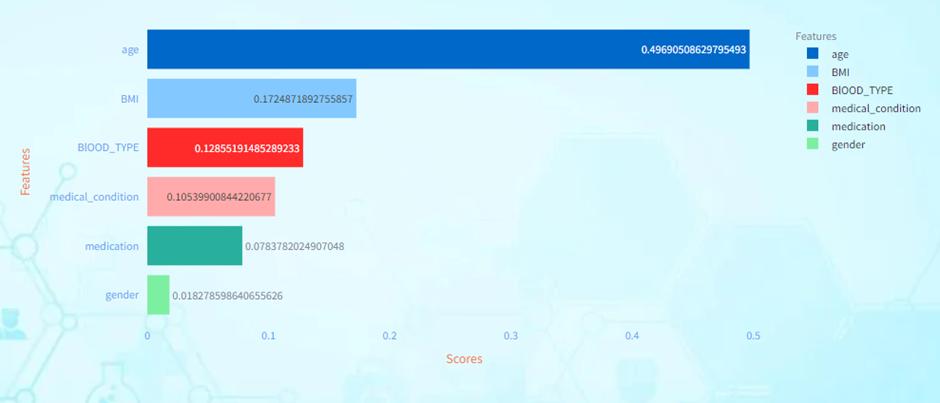
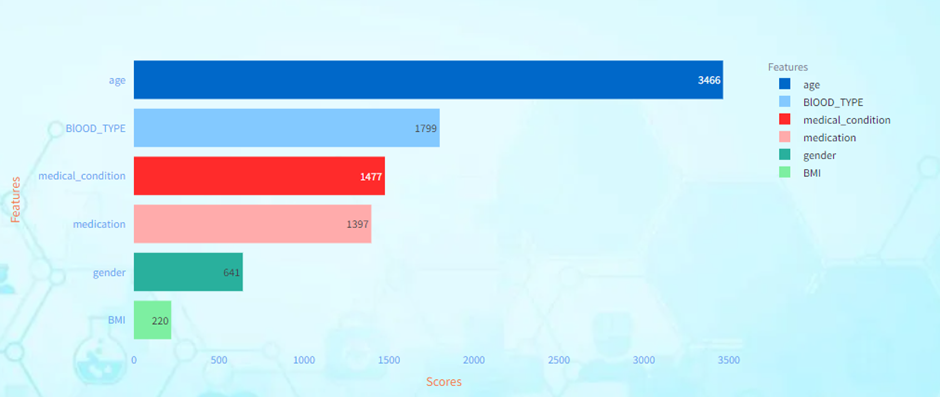
Age has the highest feature importance score among all the features. This indicates that age is the most influential factor in predicting the target variable according to the model. BMI (Body Mass Index) is the second most important feature according to the model. Gender has the lowest feature importance score among all the features. This suggests that gender has the least influence on the model’s predictions compared to the other features. And so on every other feature scores indicate their influence in predicting the target value. The higher the score, the higher the influence in prediction.
LightGBM:
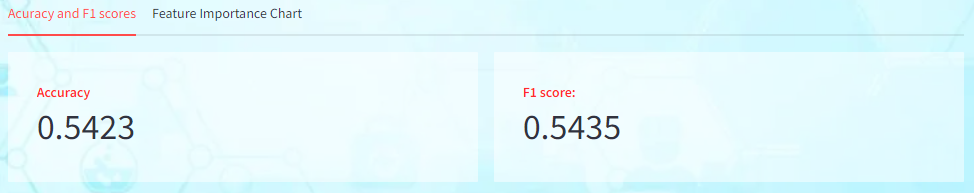
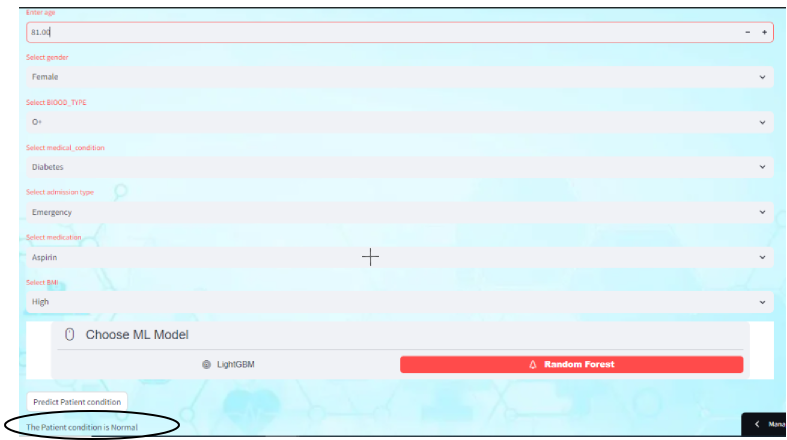
Prediction using the models:
Using the models built for prediction involves leveraging the power of ensemble learning to make accurate predictions across various domains. Users can input relevant patient information, such as age, gender, medical condition, etc. The built models then predict the potential outcome, such as the severity of the medical condition or the likelihood of a particular test result. The result can be predicted using both the models.
Currently displaying the predicted output based on Random Forest.
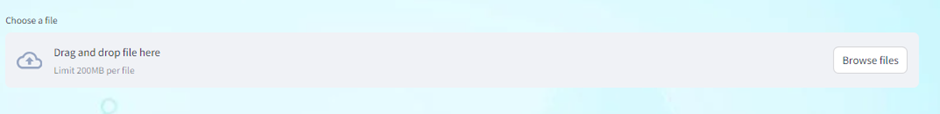
Batch Prediction:
By leveraging the predictive models, we can predict outcomes for all records in the dataset. This comprehensive analysis provides valuable insights into patient conditions and helps healthcare providers prioritize interventions and allocate resources efficiently.
1)Upload a .csv file of the below format.
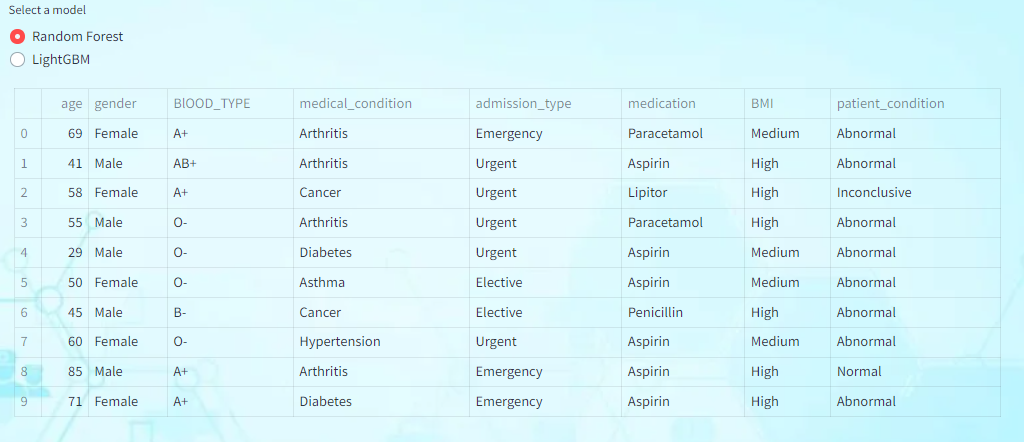
2)Choose any model from the “select a model” radio button to predict the outcomes of all the records.
Choose a model to get the predicted output:
Conclusion:
The Patient Condition Analysis Dashboard and Prediction system empowers practitioners with data-driven insights and predictive capabilities. By incorporating additional features along with an expansive data set and amalgamating advanced analytics techniques, it will facilitate more personalized care and improve patient outcomes. As healthcare continues to evolve, leveraging technology to extract actionable insights from vast datasets becomes imperative, ushering in a future where proactive and personalized healthcare is the norm.
Visit the Streamlit App: Patient Condition Analysis and Prediction App to explore these features firsthand and gain a deeper understanding.
You can find the app code in the mentioned URL : https://github.com/gitalf96/Healthcare
Please feel free to get in touch with us regarding your Streamlit solution needs. Our Streamlit solutions encompass a range of services and tools designed to streamline your data visualization, quick prototyping and dashboard development processes.