
- December 8, 2019
- Posted by: Radhakrishnan N
- Category: Tableau
Radar Chart
Radar charts are a great way to compare members of a dimension in a function of several metrics. Radar charts are very useful when comparing performance/measurement results, analyzing statistics, etc. For example, when you want to buy any product like Shuttle Bat, you can use a radar chart to compare several devices across several metrics like Durability, Repulsion Power, Control, Shock Absorption, Hitting sound etc. Here’s how to create a radar chart in Tableau.
Trigonometry
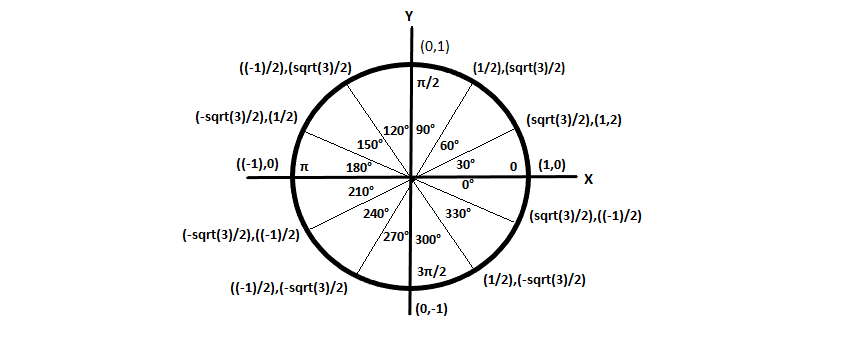
To create a radar chart, we need to use trigonometry formulas. Please refer below image to know the trigonometry values for all the angles.
Create Calculated Field
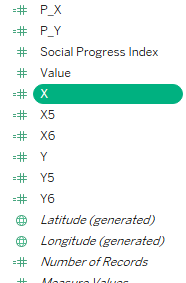
We must create calculated field for X axis and Y axis Based on the above trigonometry values, below is the example.
case [Dimensions]
when “Dimension 1” then 0
when “Dimension 2” then [Value] *(1/2)
when “Dimension 3” then [Value] *(sqrt(3)/2)
when “Dimension 4” then [Value]
when “Dimension 4” then [Value] *(sqrt(3)/2)
when “Dimension 5” then [Value] *(1/2)
when “Dimension 6” then 0
when “Dimension 7” then [Value] *(-1/2)
when “Dimension 8” then [Value] *(-sqrt(3)/2)
when “Dimension 9” then [Value] *(-1)
when “Dimension 10” then [Value] *(-sqrt(3)/2)
when “Dimension 11” then [Value] *(-1/2)
end
In addition to that, the values need to be calculated within accordance worth how many “legs” you want your chart to have. Thus, the formula you use will differ between a 5, 6 or 12 axis charts.
Here I have created X and Y axis with 5,6,12 Values .so that we can achieve different combination of legs in radar chart.
Field Mapping
Below are the steps to create Radar Chart
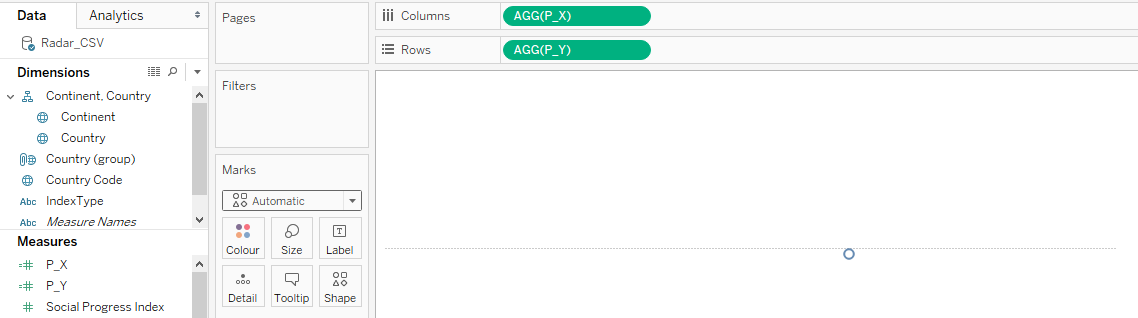
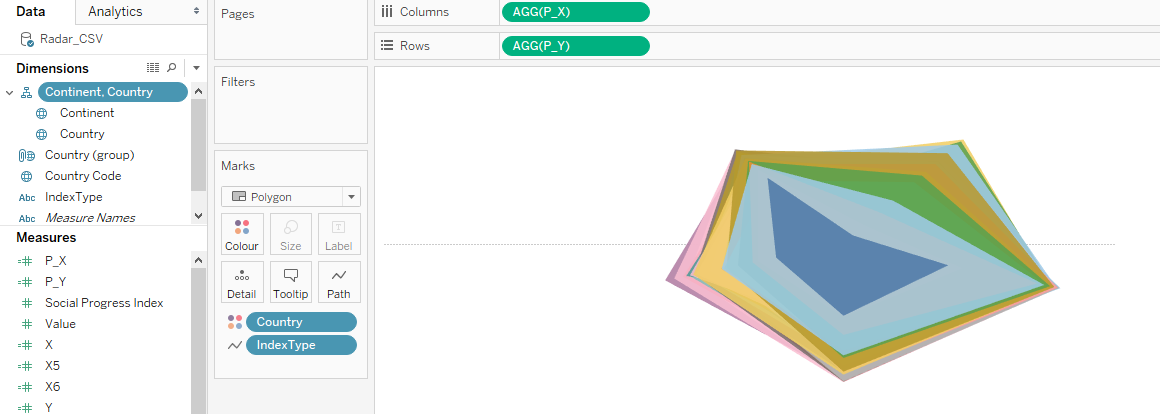
Drag X and Y Axis fields to Columns and Rows
Change Mark Type to Polygon add dimension to path,
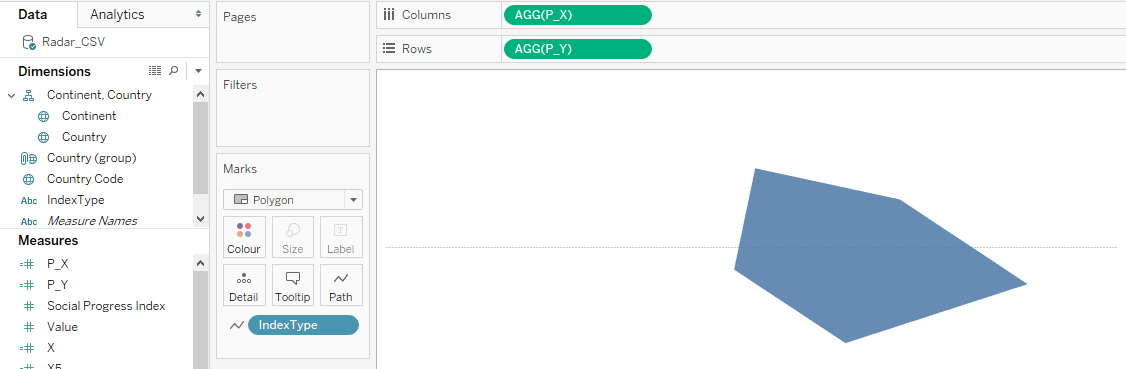
We will get the Radar plot image after adding Dimension to Path.
Add another dimension into the color, so that we will get multiple radar charts in the same coordinates. So that we compare the multiple dimensions with multiple members in same chart.
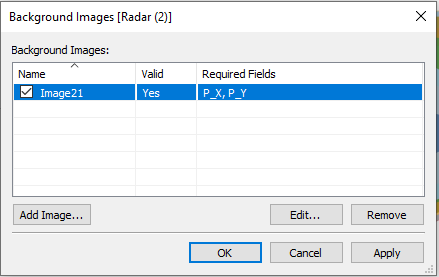
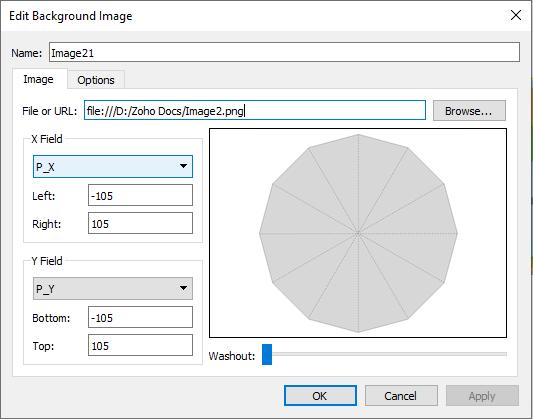
Background Image
Add Radar background Image for better visual appearance.
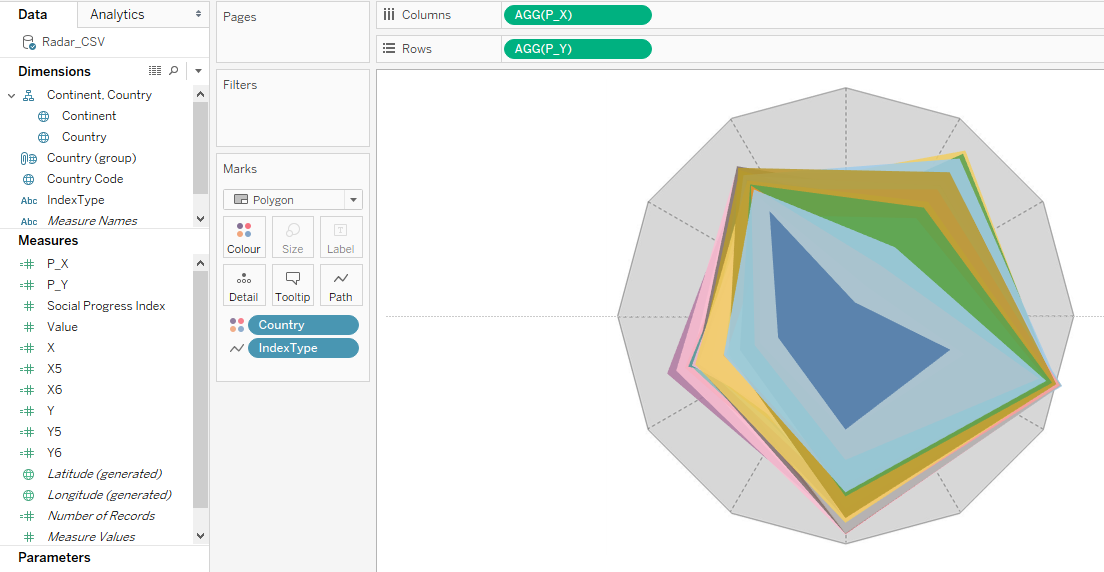
After adding the Radar Background Image, we will get the perfect Radar Chart.
Parameter
I have added a parameter to control the legs of the radar chart.
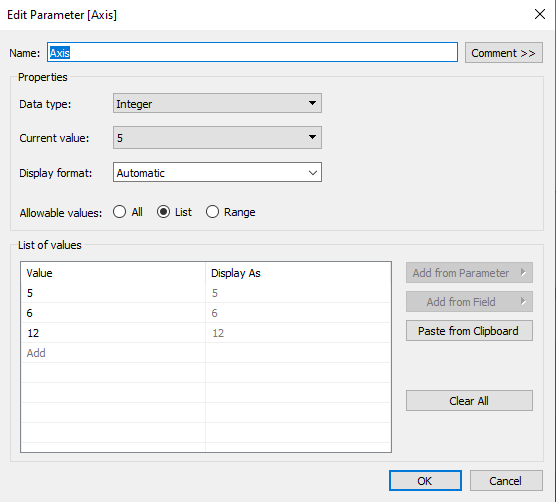
Based on the Parameter created another X and Y axis to control the Radar chart legs based on the parameter selection, below is the example.
case [Parameter]
when 5 then avg([X Axis_5])
when 6 then avg([X Axis_6])
when 12 then avg([X Axis_12])
end
I have added few maps and Parameter selection to make the dashboard more interactive.
Below is the gif file
Drawbacks:
Polygon marks are used to create Radar chart, since Polygons not support data labels,we can add Data labels by adding annotation in Tableau, but annotation not help while using multiple dimensions and Parameters.
With the above steps, you can create a Radar Chart. Please feel free to reach gotableau@sandbox.cittabase.com for more information.
And also visit our Tableau Public site.