
Motion Chart in Tableau
- November 25, 2019
- Posted by: Vivek Ramesh
- Category: Tableau
Motion chart shows data using the X and Y-axis, displaying changes over time by showing the movement of data points within the defined space. The main advantage of motion chart is to view the entire trail of how the data has changed over time. Motion chart is one of the best feature tableau desktop has we can explore this chart in many business use case and in other domains like Healthcare, Manufacturing, Sales, Telecom and many more.
To create this chart make sure you have atleast one time dimension and one measure.
Follow my steps to create your first motion chart using tableau desktop.
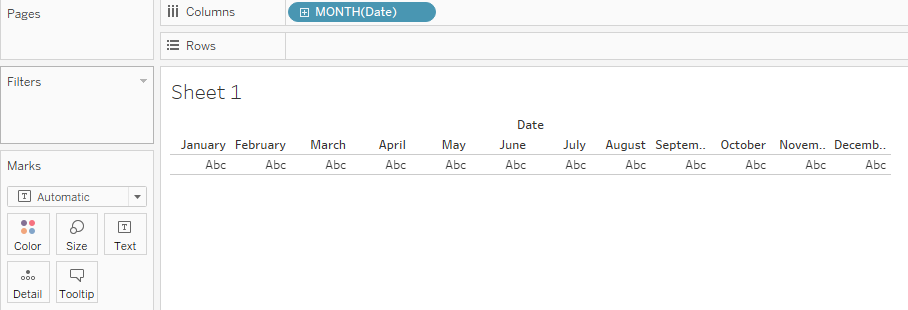
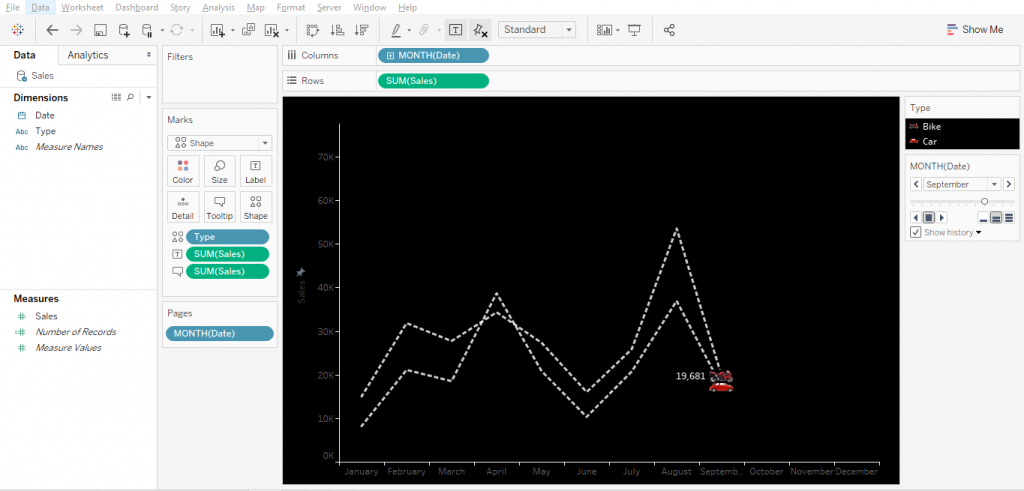
Step1: Drag the dimension Date into the column shelf and choose Month option.
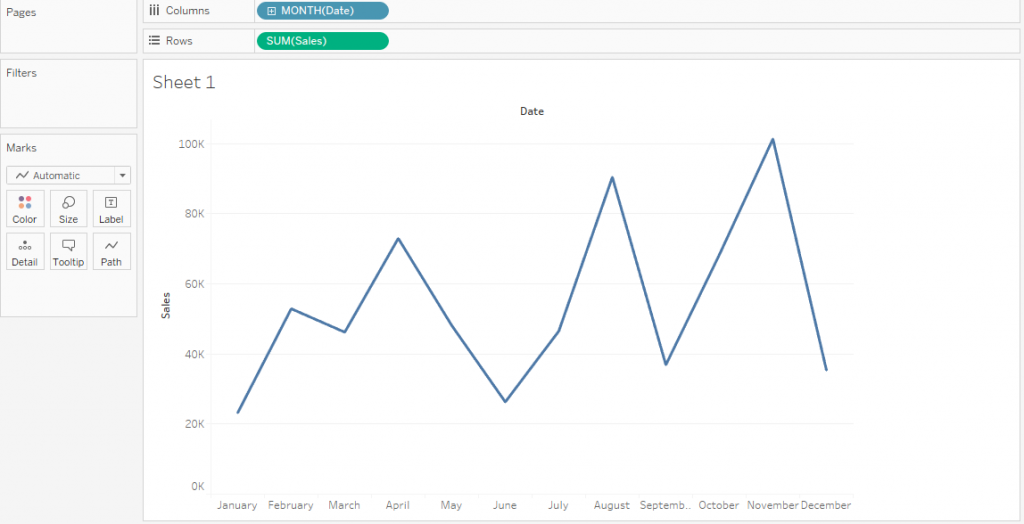
Step2: Drag the measure Sales to the rows shelf. Chart appears as shown in the below screenshot.
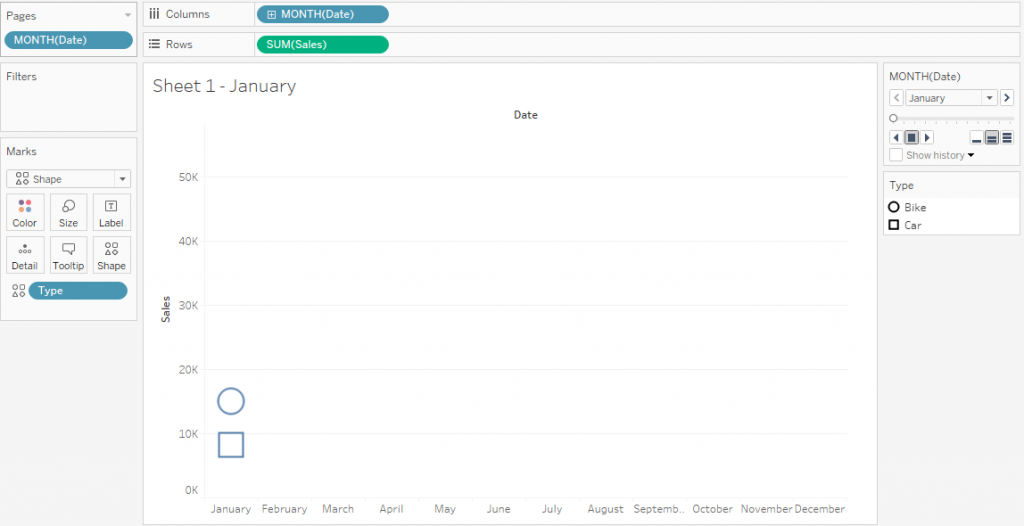
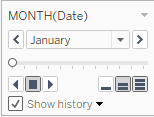
Step3: Drag the dimension Date into the page shelf and choose Month option.
Step4: Drag the dimension Type in Shapes into marks shelf.
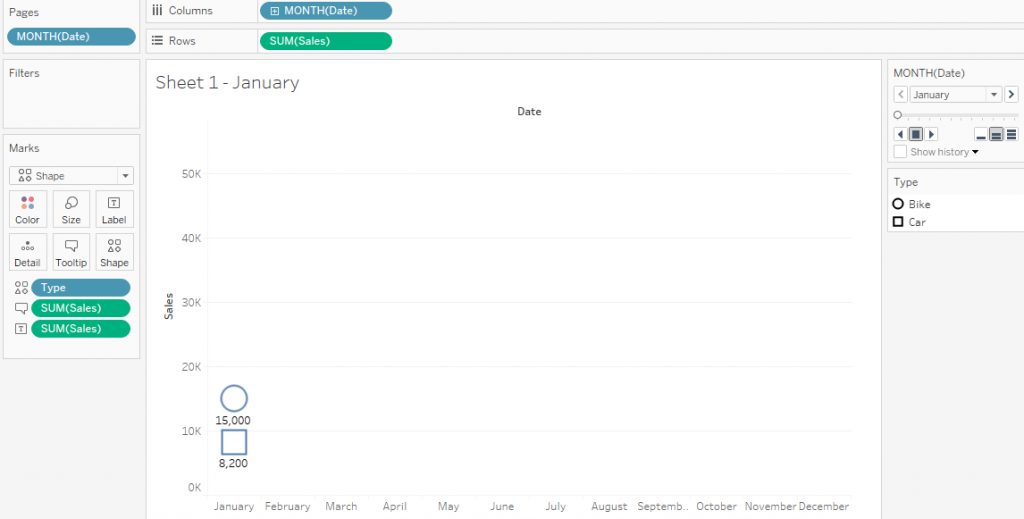
Step5: Drag the measure Sales in label and tooltip into marks shelf.
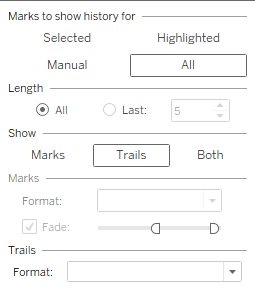
Step6: Put a checkmark in the box next to Show History button and then click on the dropdown arrow next to it. For “Marks to Show History For” option, select All. And under “Show” option, you can select Trails option.
Step7: Click the Play button and below chart appears.
Tip:
In case you need to loopback the animation, you can click on dropdown on top-right corner of your page control card, and select Loop Playback.
Refer this GIF.
Drawbacks:
Tableau Server does not support the animation effect that you see when working on motion charts with Tableau Desktop.
With the above steps, you can create a Motion Chart. Please feel free to reach gotableau@sandbox.cittabase.com for more information.
And also visit our Tableau Public site.