
Oracle APEX offers the ability to seamlessly incorporate OpenAI functionalities into your application, tailored to your dataset. Additionally, it empowers you to enhance client-side functionality through the utilization of JavaScript libraries and CSS classes.
This blog outlines the process of leveraging OpenAI to generate queries and utilizes JavaScript pivot tables to create charts and reports based on user-entered text within Oracle APEX. The search functionality is confined to a specified dataset, which can be defined as a profile. Users have the flexibility to search for any data within this dataset by entering their desired search text.
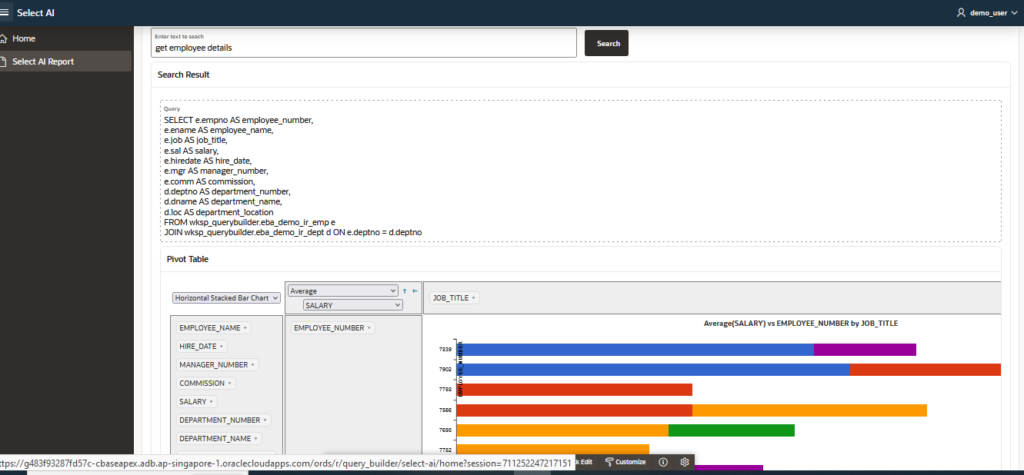
We will develop an APEX user interface that displays the query and a pivot table featuring various charts and reports corresponding to the searched text.
Following are the implementation steps.
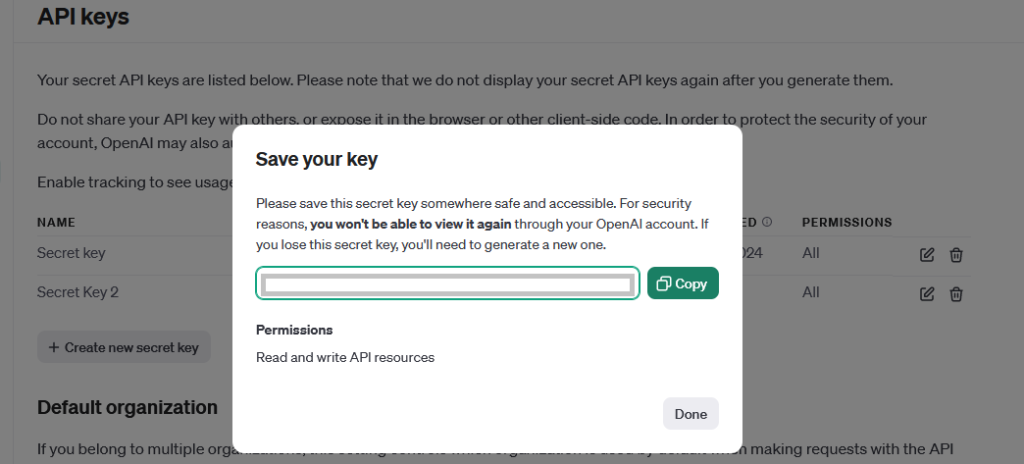
Step 1 : Create an API Key in OPEN AI .
Step 2 : Give access for the DBMS_CLOUD and DBMS_CLOUD_AI to your database schema.
grant execute on DBMS_CLOUD to WKSP_XXXX;
grant execute on DBMS_CLOUD_AI to WKSP_XXXX;
Step 3 : Create open AI credential using the key generated in Step 1.
BEGIN
DBMS_CLOUD.create_credential(‘<<OPENAI_CRED_NAME>>’, ‘OPENAI’, ‘<<Open AI Secret Key>>’);
END;
Step 4 : Create profile for the list of objects for which you wanted to use OPEN AI for SQL generation.
BEGIN
DBMS_CLOUD_AI.CREATE_PROFILE(
profile_name => ‘<<OPENAI_PROFILE_NAME>>’,
attributes => ‘{ “provider”:”openai”,
“credential_name”: “<<OPENAI_CRED_NAME>>”,
“object_list”:
[{“owner”: “WKSP_QUERYBUILDER”,”name”: “EBA_DEMO_IR_DEPT”},
{“owner”: “WKSP_QUERYBUILDER”,”name”: “EBA_DEMO_IR_EMP”},
]
}’,
description => ‘AI profile to use OpenAI for SQL generation’
);
END;
Step 5 : Create an APEX page with input text and Search button.

Step 6 : Create process to get the search result. Call the below function to get the query for the entered text. Pass the user entered text , profile name and action as ‘showsql’ to dbms_Cloud_ai.generate to get the SQL for the entered text.
dbms_cloud_ai.generate(
prompt => <<User Input>>,
action => ‘showsql’,
profile_name => <<OPENAI_PROFILE_NAME>>
);
Step 7 : Generate JSON for the query result. Below function gets in the query returned in Step 6 as input and return JSON object as output.
function generate_json (p_query in varchar2
) return clob
as
l_json_object json_object_t;
c number;
colcnt number;
desctab dbms_sql.desc_tab;
l_json_array json_array_t ;
l_column_names varchar2(100);
l_n_rowcount number;
namevar varchar2(1000);
l_value varchar2(1000);
numvar number;
datevar date;
begin
l_json_object := json_object_t();
l_json_array := json_array_t();
c := dbms_sql.open_cursor;
dbms_sql.parse (c, p_query, dbms_sql.native);
dbms_sql.describe_columns(c, colcnt, desctab);
for i in 1 .. colcnt loop
l_column_names := desctab(i).col_name;
if desctab(i).col_type = 2 then
dbms_sql.define_column(c, i, numvar);
elsif desctab(i).col_type = 12 then
dbms_sql.define_column(c, i, datevar);
else
dbms_sql.define_column(c, i, namevar, 100);
end if;
end loop;l_n_rowcount:=dbms_sql.execute(c);
while dbms_sql.fetch_rows(c) > 0 loop
— define columns
for i in 1 .. colcnt loop
l_column_names := desctab(i).col_name;
if desctab(i).col_type = 2 then
dbms_sql.column_value(c, i, numvar);
l_value := to_char(numvar);
elsif desctab(i).col_type = 12 then
dbms_sql.column_value(c, i, datevar);
l_value := to_char(datevar,’dd-mon-yyy’);
else
dbms_sql.column_value(c, i, namevar);
l_value := namevar;
end if;l_json_object.put(l_column_names,l_value);
l_json_array.append(l_json_object);
end loop;
end loop;
return l_json_array.to_clob();
exception
when others then
return ‘error’;
end;
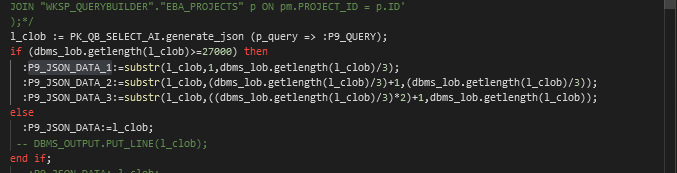
Step 8 : Set the JSON_DATA to a hidden apex page item. Store the values in multiple page items as the page item has size limitation for CLOB datatype as well.
Step 9 : Create a JavaScript function to create pivot table for this JSON value.
function pivot_chart() {
var jsonData = $v(‘P9_JSON_DATA’);
if (!jsonData)
{
var jsonData = $v(‘P9_JSON_DATA_1’).concat($v(‘P9_JSON_DATA_2’),$v(‘P9_JSON_DATA_3’));
}
else
{
var jsonData = $v(‘P9_JSON_DATA’);
}
// alert(jsonData);
$(“#output”).pivotUI(JSON.parse(jsonData), {
renderers: renderers,
cols: [], rows: [],
rendererName: “Horizontal Stacked Bar Chart”,
rowOrder: “value_z_to_a”, colOrder: “value_z_to_a”,
rendererOptions: {
c3: { data: {colors: {
1: ‘#dc3912’, 2: ‘#3366cc’, 3: ‘#ff9900’,
4:’#109618′, 5: ‘#990099’
}}}
}
}
);
Step 10 : Include following libraries to generate PIVOT table.
JS libraries
https://pivottable.js.org/dist/pivot.js
https://cdnjs.cloudflare.com/ajax/libs/c3/0.4.11/c3.min.js
https://pivottable.js.org/dist/c3_renderers.js
https://cdnjs.cloudflare.com/ajax/libs/jqueryui/1.11.4/jquery-ui.min.js
https://cdnjs.cloudflare.com/ajax/libs/pivottable/2.13.0/pivot.min.js
https://cdnjs.cloudflare.com/ajax/libs/pivottable/2.23.0/c3_renderers.min.js
CSS
https://cdnjs.cloudflare.com/ajax/libs/pivottable/2.13.0/pivot.min.css
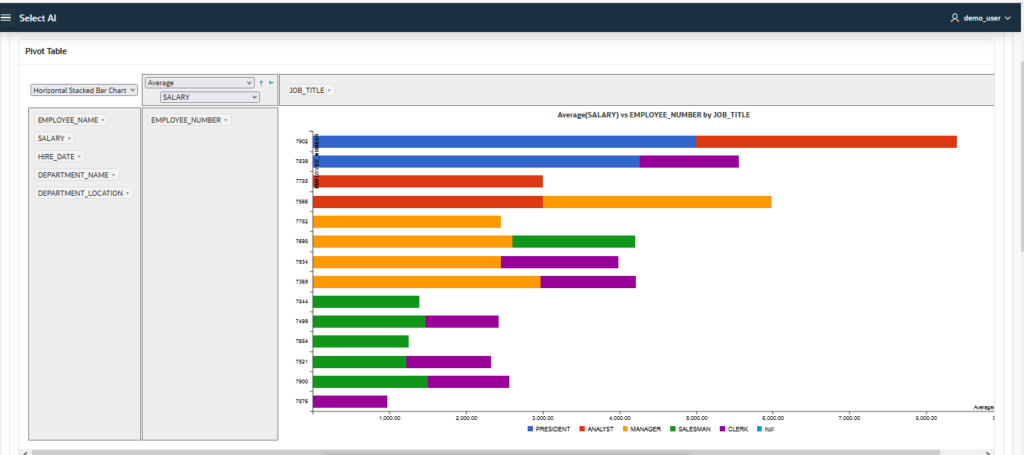
Following is the pivot table output that will be generated for any given prompt.
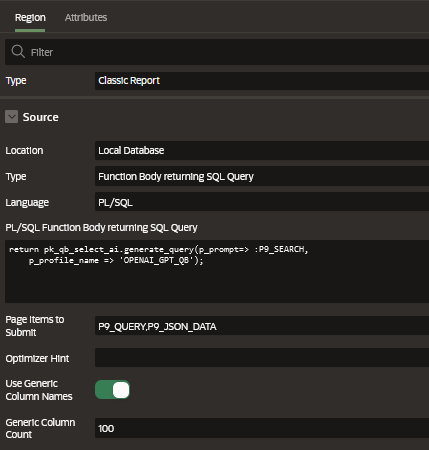
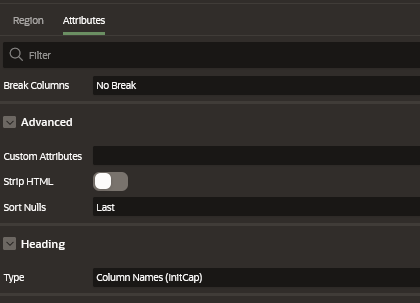
Step 11 : Pass the query returned in Step 6 as input to classic report with generic columns turned on and heading type as column names to get the result set in report.
Oracle APEX offers versatility in building applications that analyses and visualize your data, incorporating both OpenAI integration and JavaScript extensions.
Please feel free to reach out to us to discuss how we can address your needs in the Oracle APEX. We offer customized solutions designed to effectively meet your specific requirements.