
- December 16, 2019
- Posted by: Sriram Kalyanaselvan
- Category: Tableau
Introduction
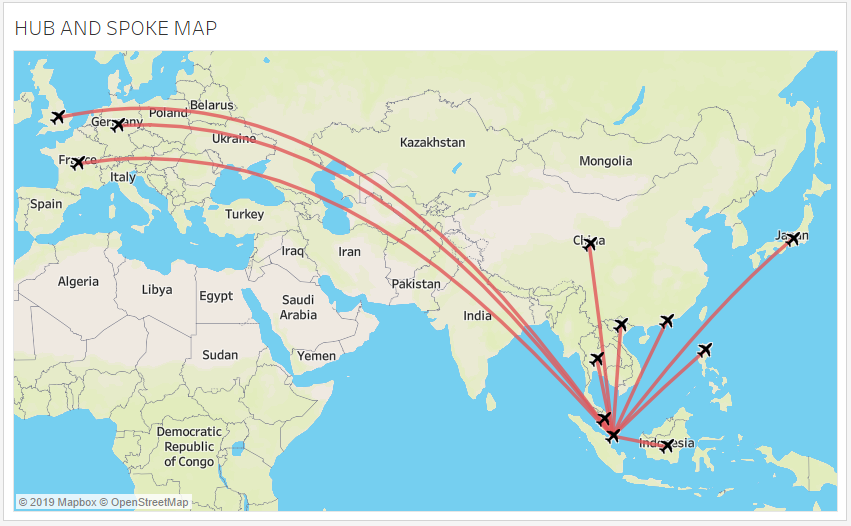
Hub and spoke chart are used to plot locations on a map, along with lines between the origin and one or more destinations. Hub and Spoke maps can be used to visualize connecting flight routes, Logistic tracking, migration patterns of birds. More specifically it helps in the logistics domain to deliver products in the most cost-effective and timely possible by building warehouse in more access able location. It also helps in Health care domain, as building a health care center in a place where most of the people can access it.
In the following case Hub and Spoke map is used to draw the path between the flight disembarkation from Singapore to various countries around the world.
Here we have used MAKEPOINT() and MAKELINE() functions to build Hub and Spoke map. Which are the two new spatial functions used for Geo-spatial analysis.
A hub and spoke map connecting origin to one or more destination points.
NOTE: For Hub and Spoke map we need a data set with Latitude and Longitude detail of both the source and the destination.
Step 1
This map type was built with the help of a dual-axis chart. With one chart shows the Hub(Home location) and another chart shows the Spokes(Lines to countries).
Create a dual map chart by placing Longitude on columns shelf and two Latitudes on Rows shelf.
Step 2
The Hub point is declared using MAKEPOINT() function with latitude and longitude of the home location.
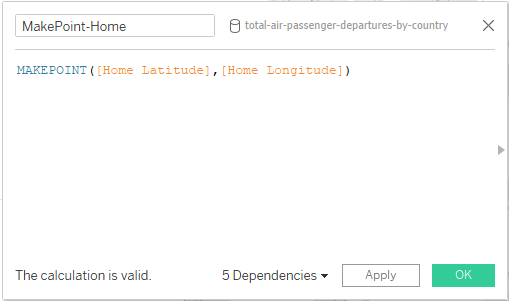
The MakePoint-Home measure is then dragged and dropped into the HUB’S detail shelf. Which gave us a point in our Hub location.
Step 3
Now we have to mark the countries on the other axis, which can be achieved using MAKEPOINT() with latitude and longitude of the countries.
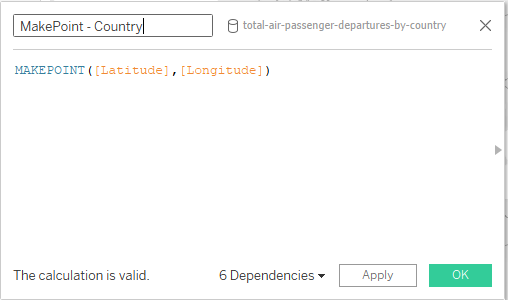
The MakePoint-Country measure is then dragged and dropped into the SPOKE’S detail shelf. Which generates points on various countries.
Step 4
The Line from Hub to the various location has to be achieved using the MAKELINE() Function.
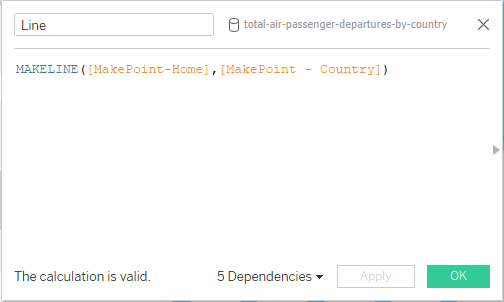
Drop the Line calculated field above Makepoint-home in the HUB’S detail shelf. Which in turn gives a line from the Hub locations to various countries.
Step 5
Combine both charts using a dual-axis option. Finally, the Hub and Spoke map built.
Step 6
Formatting has to be done as required. The Final Outcome of the above Hub and Spoke map be like.
Here is the Link to Interactive Dashboard : shorturl.at/lmru3
Data Source : https://data.gov.sg/
Advantages
Hub and spoke maps help to locate main hubs for logistics warehouses as the distribution would be done from there will help to reduce transaction cost and delivery would be done in an optimized way.
Drawbacks
The Hub and Spoke model is centralized, any changes at the hub may have unexpected consequences in the network. This may lead to difficulty in handle periods of high demand between two spokes.
With the above steps, you can create a Hub and Spokes map. Please feel free to reach gotableau@sandbox.cittabase.com for more information. And also visit our Tableau Public site.