
- March 21, 2019
- Posted by: Abishek Venkatakrishnan
- Category: Technology
In this blog, we leverage DV’s new feature of executing Python scripts. The custom Python script for Term Frequency Analysis accepts one text column as input. The script cumulates the text values and then breaks that collection into recognizable tokens and counts the number of times each token has occurred. It gives the term (token) and its corresponding frequency as output.
We can upload the customized scripts written as DV standard XML format.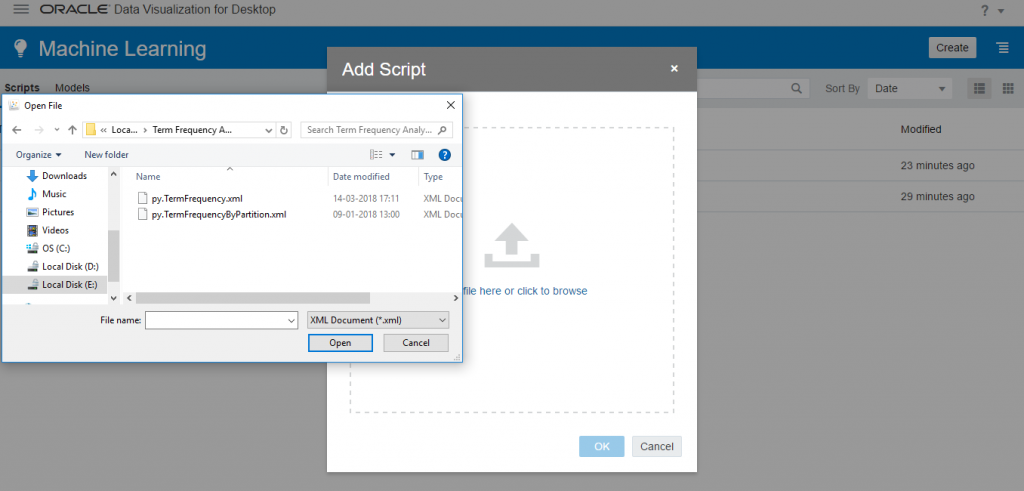
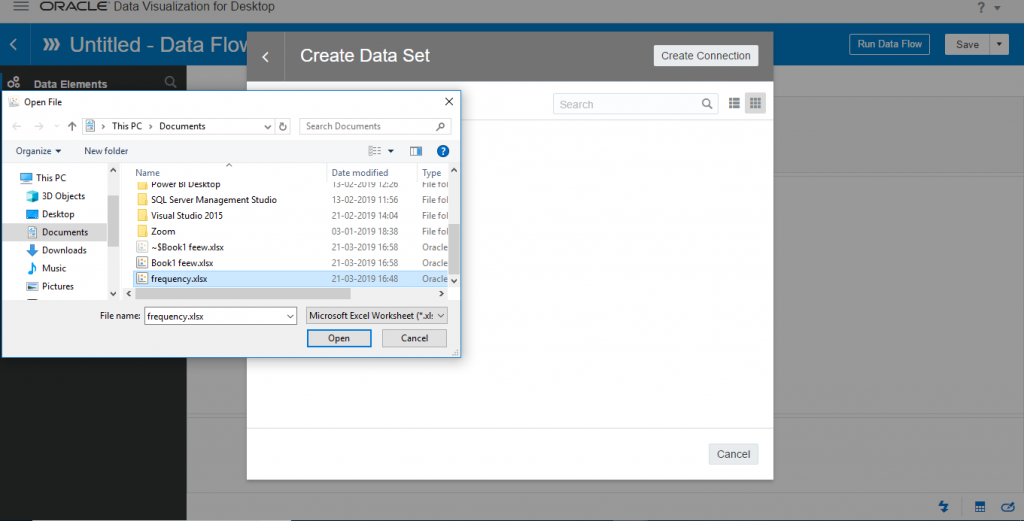
And now, let’s create a data-flow with the textual dataset on which, we want to apply our term frequency script .we will use the output of this data flow for term frequency data visualization.
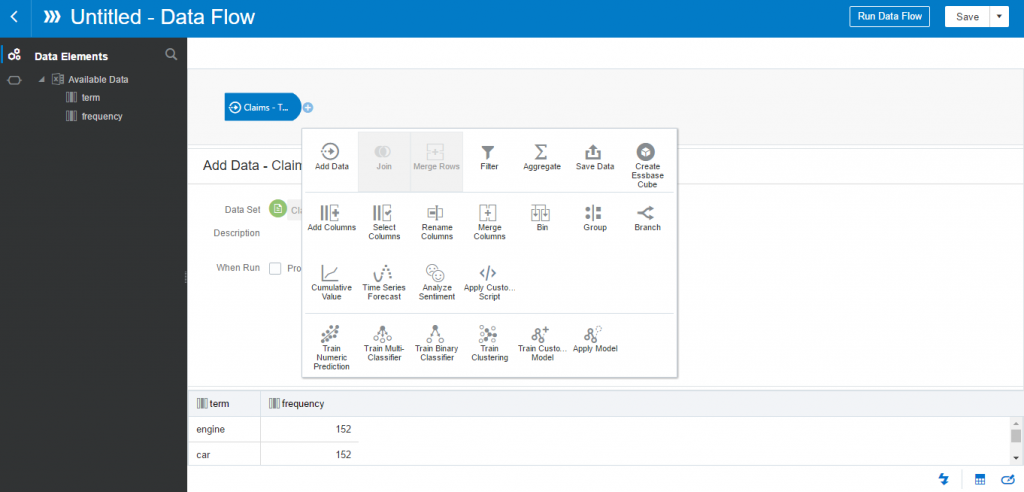
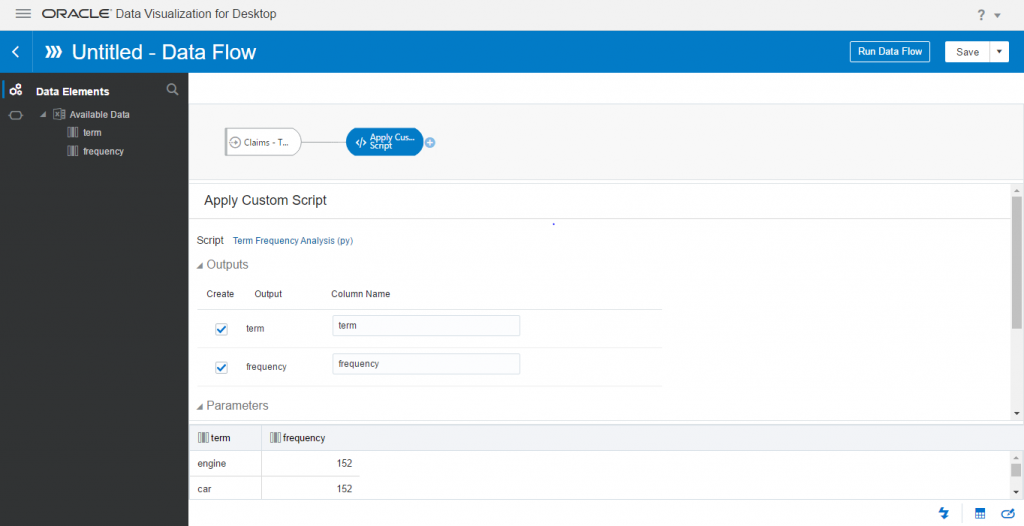
Select the ‘+’ sign and add Apply custom script.
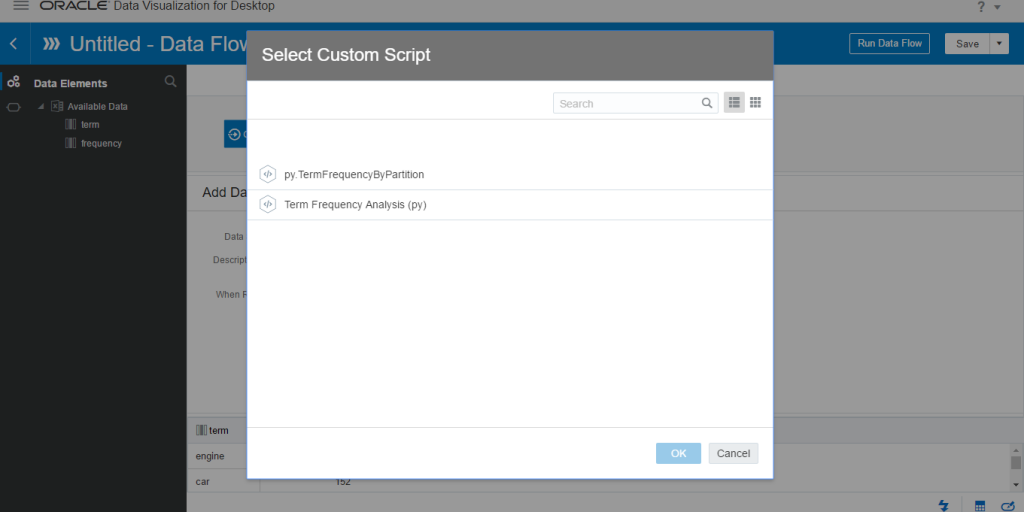
Here the script just loaded.
A user may change the parameter, input column and output column based on input column names and expected a topN result.
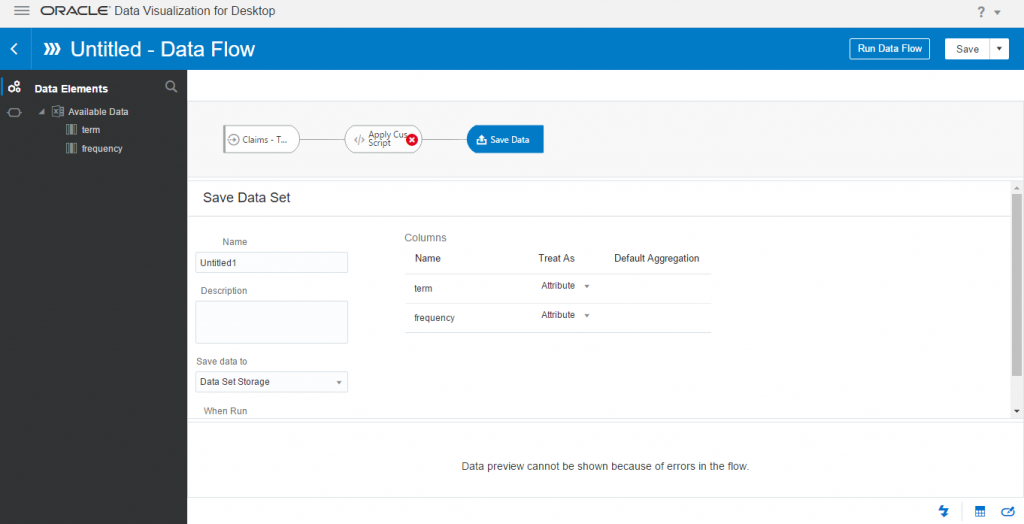
Add save data node to save the dataset returned by python. The result has two columns,Term and frequency. To generate the dataset, Save and Execute the dataflow . The generated dataset can be accessed by going to the data tab.
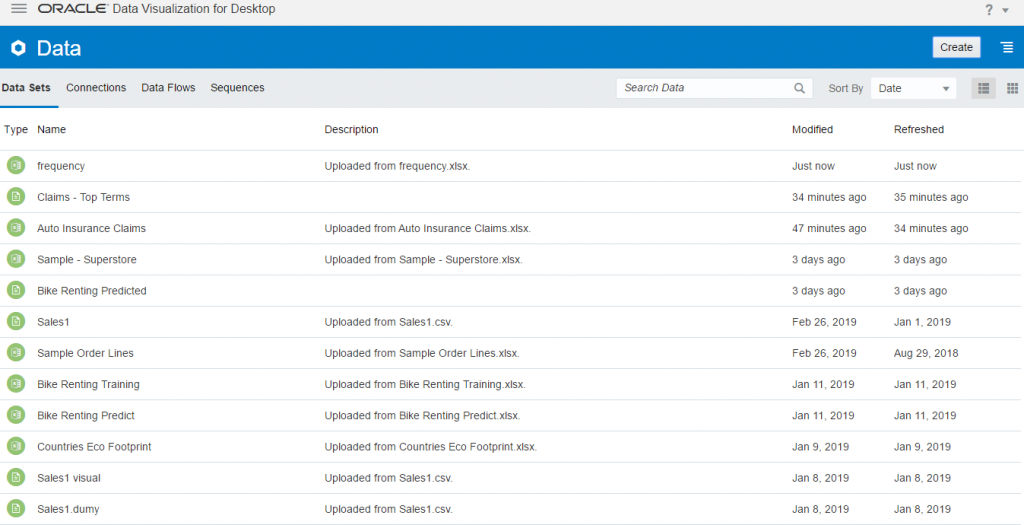
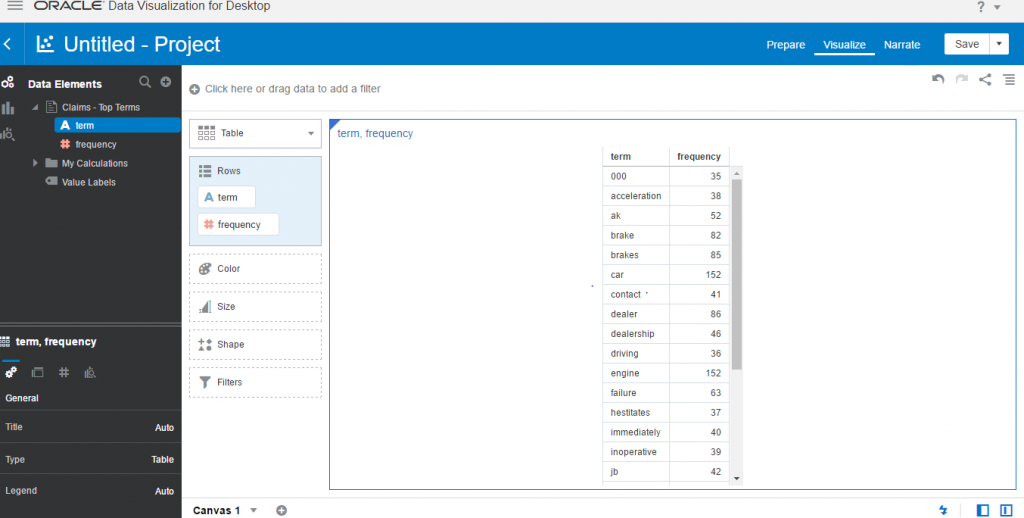
Output dataset is just like a regular dataset. Let us create a project using it to analyse term frequency.
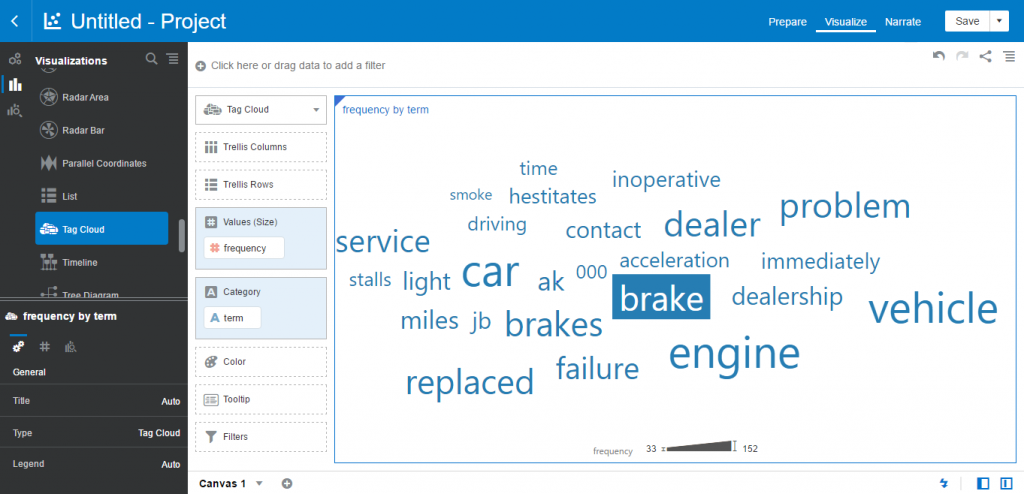
Conclusion:
As you can see, Data Visualisation Desktop has built-in Analytics on “click” that can be deployed without any coding, just by dragging & dropping by using Python Script. In the next post, I will explain how to use Analytical Functions and how you can use Machine learning with Data Visualisation Desktop.