
- April 5, 2019
- Posted by: Abishek Venkatakrishnan
- Category: Technology
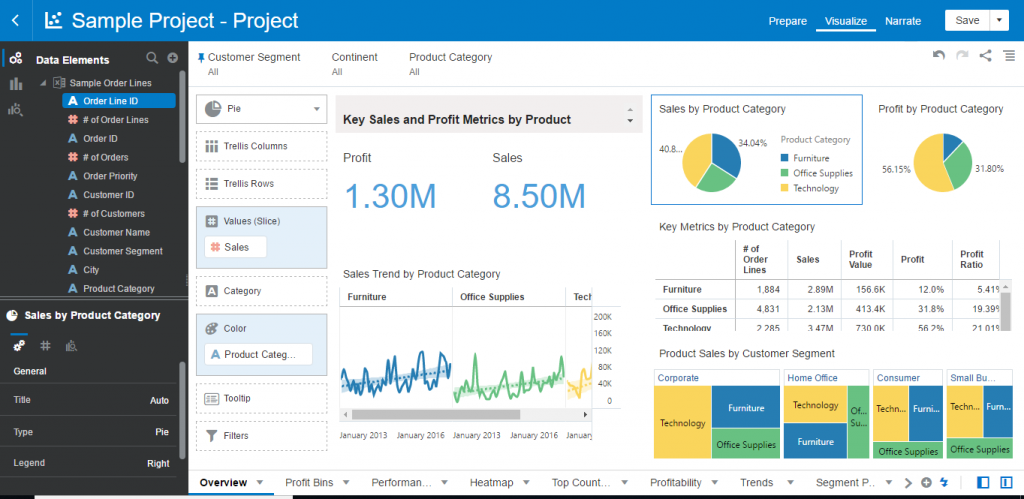
The Story Navigator allows you to tell a story by sharing a series of insights with your audience. Digging deeper and deeper into your analysis until you reach the point you want to make or the conclusion you want to share.
Building a story is basically just creating a sequence of analysis. Once you have created your first analysis, open the story navigator and create your first insight in your story.
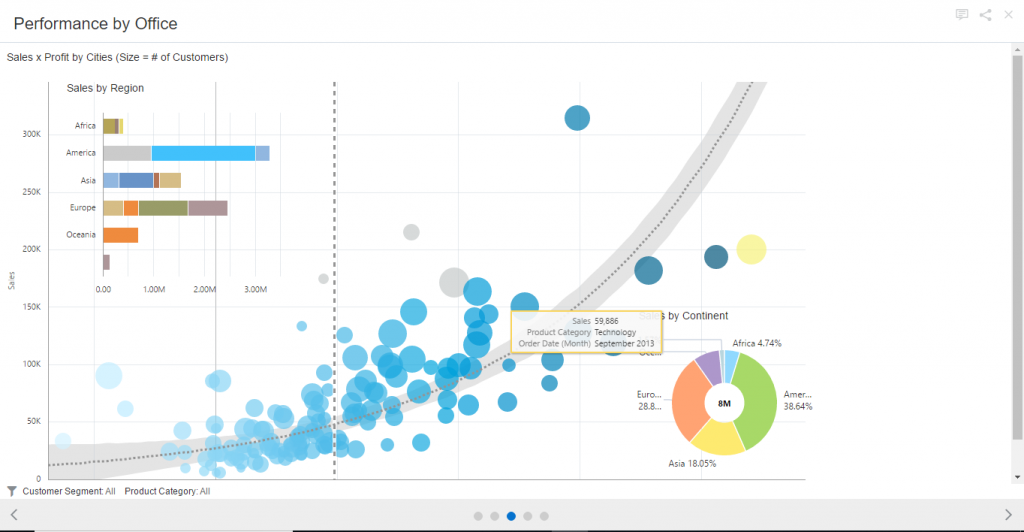
From here, just continue developing your analysis and each time you have reached a visualization you want to share in your story, add it as a new insight (Add Story in canvases). Notice how in the screenshot below.
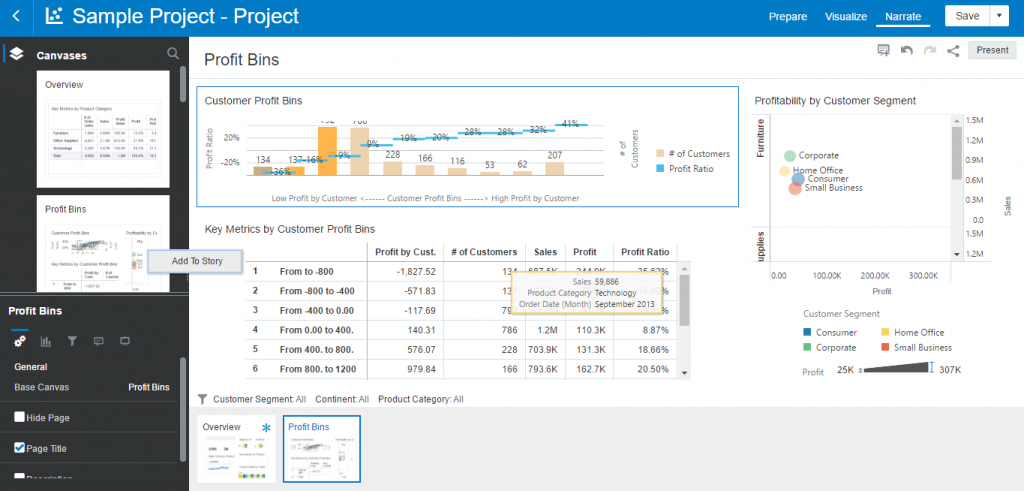
And while you develop your story, by adding more insights, details, and visualizations, more screenshots start appearing.
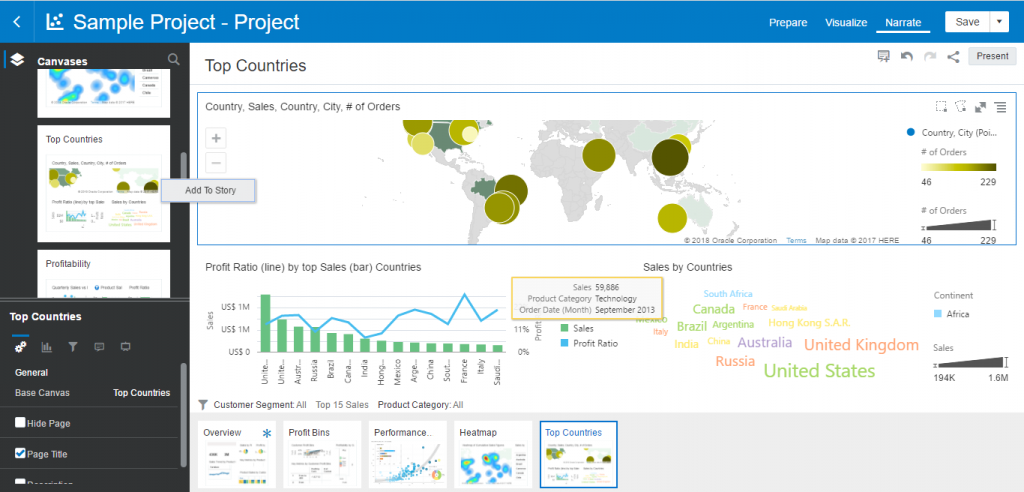
When you found in the data the conclusion you want to present, all that is bottom is to rename the insights and add a description to make the story come together. There is a shortcut in the left menu bar that allows you to easily go over each of them to change their name or add a description.

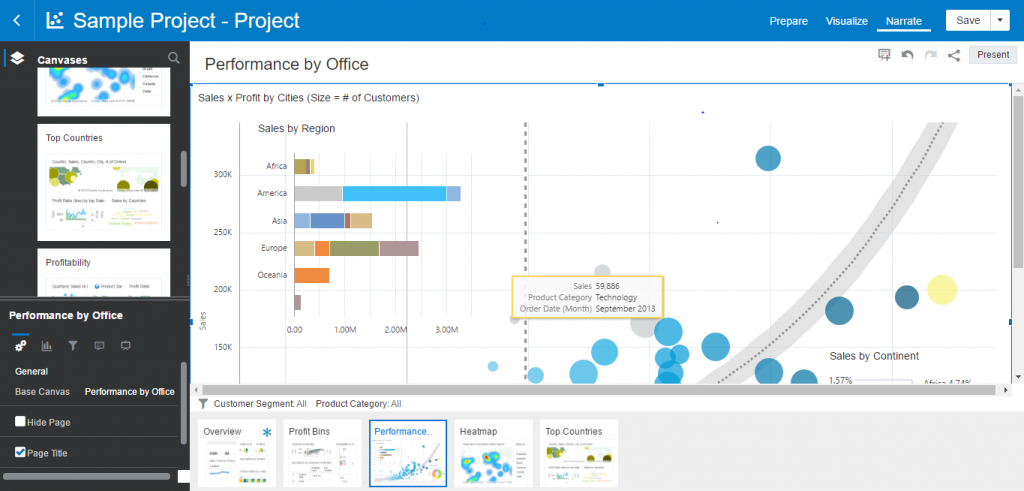
Presenting your Story
Once your story is ready to be presented, get into presentation mode and all the analysis creation options will disappear leaving you with your story and the dots at the bottom of the screen to navigate from insight to insight. How much easier can it get!
Conclusion:
As you can see, Data Visualisation Desktop has built-in Analytics on “click” that can be deployed without any coding, just by dragging & dropping by creating the story navigator. In the next post, I will explain how to use Analytical Functions and how you can use Machine learning with Data Visualisation Desktop.