
- May 6, 2019
- Posted by: Abishek Venkatakrishnan
- Category: Power BI
Format Painter is there a way to speed up aligning the look across different visuals in Power BI. Note in the video below, I have selected the sales dollar by category name in the right image, selected the format painter and applied it on the chart on the right.
Note this is not just updating the color but also updating all of the formatting options is automatically without manually setting.
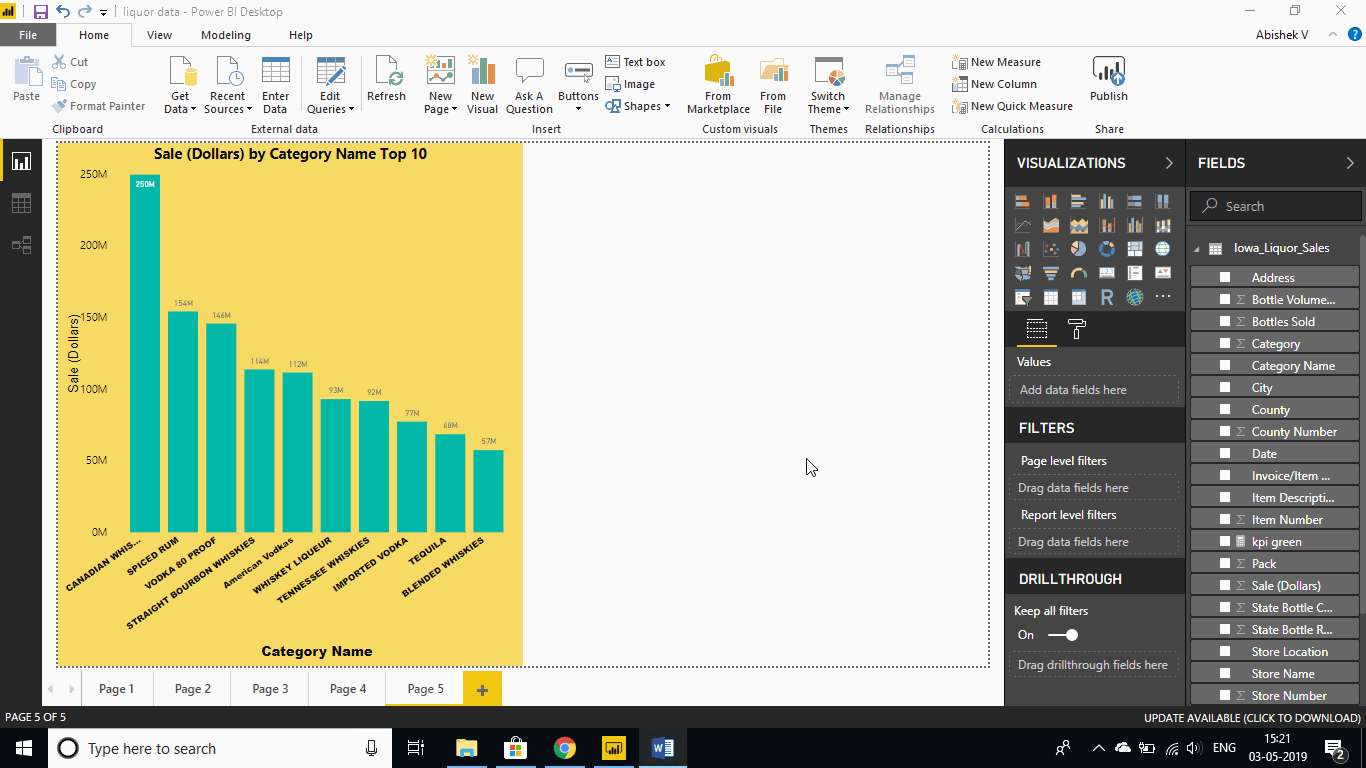
STEP 1: Select the visual that already has the desired formatting options set.
STEP 2: Click the “Format Painter” button in the Home tab of the ribbon.
STEP 3: Click the visual for which you’d like to assign the same formatting options.
The following Formatting Options are copied when using the Format Painter:
– All Background options.
– Title: All options apart from the actual text.
– Data Labels: All options except Display Units & Decimal Places.
– Data Colors: Default Color and, if the same field is used to drive color, copy the color/value assignments.
– X-Axis & Y-Axis: All options apart from Start/End.
– Legend: All options apart from the actual text.
– Borders: All options.
– Slicers: All options.
– Sentiment Colors (for Waterfall Charts): All options.
DRAWBACKS OF FORMAT PAINTER
- If options don’t exist in the target visual (e.g. copying X-Axis options from a Scatter Chart onto a Column Chart) then they are just dropped.
- While visualization (A) used legend in their charts means the same legend need to used visualization (B) then only we can use format painter otherwise it won’t applicable for visual.
Conclusion:
As you can see, Data Visualisation Desktop has built-in Power BI on “click” that can be deployed without any coding, just by dragging & dropping by using the format painter.