
- January 18, 2022
- Posted by: Divya Gandhimathinathan
- Category: Power BI
Hello folks! Here we have given detailed information about the FDA(CFR) inspection that took place across various Program Areas with the easily understandable dashboard in Power Bi.
If you are curious to know about it read my tech blog here!
In this article, the end user can easily understand the detailed information on Inspection undergone in the specific program area by FDA.
The Food and Drug Administration (FDA) conducts inspections and assessments of regulated facilities to determine a firm’s compliance with applicable laws and regulations such as the Food, Drug and Cosmetic act.
This article talks about the total count of Inspections taken place over the year and the information on Code Federal Regulation (CFR) based on the various program areas.
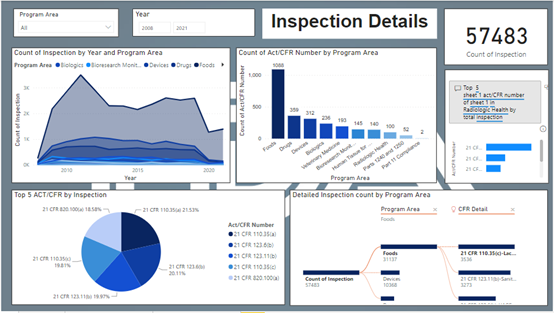
One example we have given here in the FDA Inspection Details dashboard is filtering the program area. This gives you the total count of Inspection done over the year by program area, Count of ACT/CFR Number by program area.
Data Courtesy: FDA Open Source
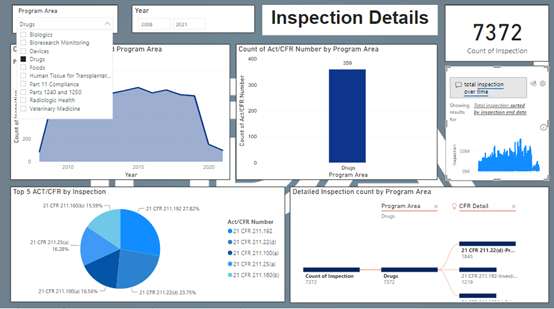
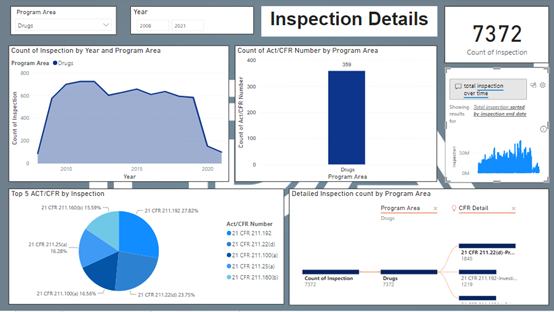
Consider, here we are taking the program area as the Drug where it shows the Total Count of inspection is displayed, and the Count of both the Act/CFR and the inspection is displayed.
We have also added the Q&A section with self-analysis capabilities where we can ask pre-defined questions about the dataset. Since Drugs plays a significant role in FDA inspection, the graph shows the number of inspections undergone for this area, and the Top 5 ACT/CFR shows the Percentage of default in this Program area.
- 21 CFR 211.192 – Production record review
- 21 CFR 211.22(d) – Written standard procedures for quality control
- 21 CFR 211.100(a) – Quality assurance on identity, strength, quality
- 21 CFR 211.25(a) – Qualified people as per their roles & responsibility
- 21 CFR 211.160(b) – Laboratory control on technical specifications using scientific methods
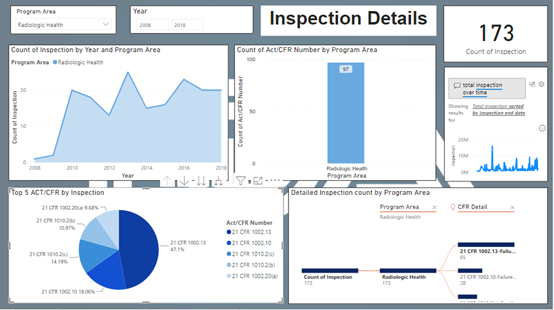
Also, we can analyse the data based on the various years between 2008-2021.For Example, we have taken the year between 2008-2018 for a specific program area Radiologic Health. As mentioned above in this article, all the data are displayed for the below filter.
We,Cittabase,is focused on providing analytics as a solution to make things easier for customers. By increasing the usage of data, a wide view of the external factors influencing the customer business is found.