
- July 18, 2020
- Posted by: Sibi Elamparithi
- Category: APEX
As we know, Oracle APEX contains various inbuilt Jet Charts. What if you need something more than the inbuilt.
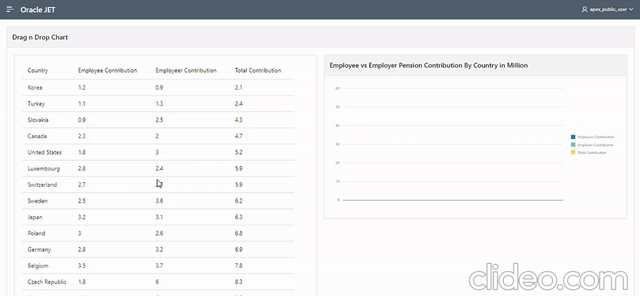
This blog will help you to embed a Drag and Drop chart from Oracle Jet into Oracle APEX. This method is also common to incorporate any Jet chart from Jet Community into Oracle APEX. A sample of what we are going to build.
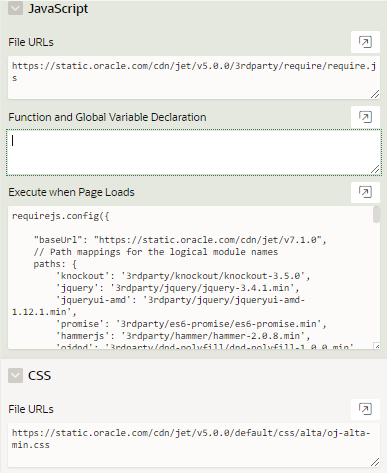
First step would be including the Require JS and Alta UI library for building the chart. Add the below URL under Javascript File URLs Section of the Page.
https://static.oracle.com/cdn/jet/v5.0.0/3rdparty/require/require.js
Add the below code to Execute when Page Load section of the Page.
requirejs.config({ “baseUrl”: “https://static.oracle.com/cdn/jet/v7.1.0”,
paths: {
‘knockout’: ‘3rdparty/knockout/knockout-3.5.0’,
‘jquery’: ‘3rdparty/jquery/jquery-3.4.1.min’,
‘jqueryui-amd’: ‘3rdparty/jquery/jqueryui-amd-1.12.1.min’,
‘promise’: ‘3rdparty/es6-promise/es6-promise.min’,
‘hammerjs’: ‘3rdparty/hammer/hammer-2.0.8.min’,
‘ojdnd’: ‘3rdparty/dnd-polyfill/dnd-polyfill-1.0.0.min’,
‘ojs’: ‘default/js/min’, ‘ojL10n’: ‘default/js/ojL10n’,
‘ojtranslations’: ‘default/js/resources’, ‘text’: ‘3rdparty/require/text’,
‘signals’: ‘3rdparty/js-signals/signals.min’,
‘customElements’: ‘3rdparty/webcomponents/custom-elements.min’,
‘proj4’: ‘3rdparty/proj4js/dist/proj4’, ‘css’: ‘3rdparty/require-css/css.min’,
‘touchr’: ‘3rdparty/touchr/touchr’ }, shim: { ‘jquery’: { exports: [‘jQuery’, ‘$’] } } });
Add the below URL under CSS File URLs Section of the Page.
https://static.oracle.com/cdn/jet/v5.0.0/default/css/alta/oj-alta-min.css
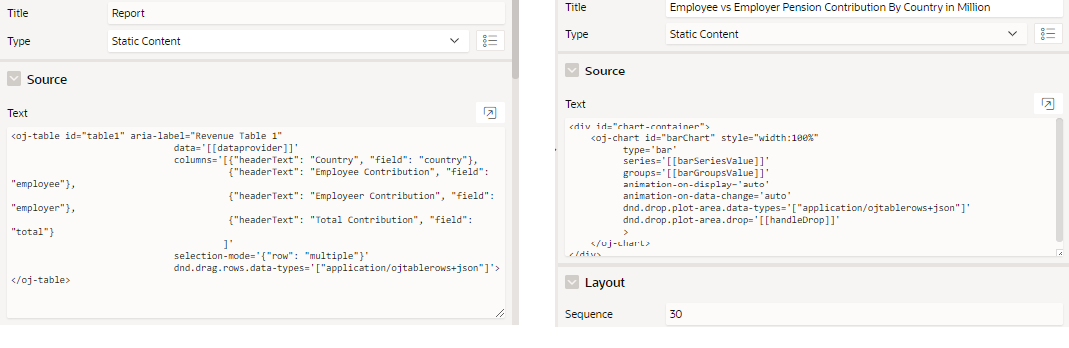
Next we need to define our report and chart properties. Create a static region for the report and add the below code.
<oj-table id=”table1″ aria-label=”Revenue Table 1″
data='[[dataprovider]]’
columns='[{“headerText”: “Country”, “field”: “country”},
{“headerText”: “Employee Contribution”, “field”: “employee”},
{“headerText”: “Employeer Contribution”, “field”: “employer”},
{“headerText”: “Total Contribution”, “field”: “total”} ]’
selection-mode='{“row”: “multiple”}’
dnd.drag.rows.data-types='[“application/ojtablerows+json”]’>
</oj-table>
For this example, I am going to build a Employee Pension contribution chart. My table will consist 4 columns and I have designed the report based on the column names. You can design you own table. Headertext defines the Report column name and field value will be used to populate the report values from JSON Data. We will see it below.
Create a second static region for the chart and add the below code to it.
<div id=”chart-container”>
<oj-chart id=”barChart” style=”width:100%”
type=’bar’
series='[[barSeriesValue]]’
groups='[[barGroupsValue]]’
animation-on-display=’auto’
animation-on-data-change=’auto’
dnd.drop.plot-area.data-types='[“application/ojtablerows+json”]’
dnd.drop.plot-area.drop='[[handleDrop]]’ >
</oj-chart>
</div>
Next step would be getting the data from the database. The data must be in a JSON format and we have to store it in a hidden item. So create a Hidden item and a Before Header process to populate the JSON data into the hidden item.
A sample procedure for converting sql data to json in Oracle as below.
BEGIN
SELECT JSON_ARRAYAGG( json_object (
‘country’ VALUE country, ’employee’ VALUE employee,
’employer’ VALUE employer, ‘total’ VALUE total) )
INTO :P2_RESULT_JSON —-your item name
FROM eba_demo_chart_stats;
END;
Keep a note that the JSON object names must be the same values that you used in the field value while defining the report region .The final step is to build the report and the chart based on the JSON data. Create a Dynamic Action with Event as Page Load and Action as Execute Javascript Code. Add the below code to the Code Section.
require([‘knockout’, ‘ojs/ojbootstrap’, ‘ojs/ojarraydataprovider’, ‘ojs/ojknockout’, ‘ojs/ojtable’, ‘ojs/ojchart’],
function (ko, Bootstrap, ArrayDataProvider) {
function TableViewModel(dataArray) {
this.dataprovider = new ArrayDataProvider(dataArray, { keyAttributes: ‘project’ }); }
function ChartViewModel() {
/* define your column names here */
var barSeries = [{ name: ‘Employee Contribution’, items: [0] },
{ name: ‘Employer Contribution’, items: [0] },
{ name: ‘Total Contribution’, items: [0] } ];
var barGroups = [‘ ‘];
this.barSeriesValue = ko.observableArray(barSeries);
this.barGroupsValue = ko.observableArray(barGroups);
this.handleDrop = function (event) {
var jsonStr = event.dataTransfer.getData(‘application/ojtablerows+json’);
if (jsonStr) { var jsonObj = JSON.parse(jsonStr);
var q1Revs = [];
var q2Revs = [];
var q3Revs = [];
this.barGroupsValue.removeAll();
this.barSeriesValue.removeAll();
for (var i = 0; i < jsonObj.length; i++) {
var rawData = jsonObj[i].data;
this.barGroupsValue.push(rawData.country);
/*define your fieldnames you used in building the report*/
q1Revs.push(rawData.employee);
q2Revs.push(rawData.employer);
q3Revs.push(rawData.total);
}
/* populate the values to respective columns */
this.barSeriesValue.push({ name: ‘Employee Contribution’, items: q1Revs });
this.barSeriesValue.push({ name: ‘Employer Contribution’, items: q2Revs });
this.barSeriesValue.push({ name: ‘Total Contribution’, items: q3Revs });
}
event.stopPropagation();
event.preventDefault();
}.bind(this); }
Bootstrap.whenDocumentReady().then( function () {
/*get the json data from hidden item*/
var dataArray = $(“#P2_RESULT_JSON”).val();
dataArray = JSON.parse (dataArray);
ko.applyBindings(new TableViewModel(dataArray), document.getElementById(‘table1’));
ko.applyBindings(new ChartViewModel(), document.getElementById(‘chart-container’)); } );
});
Using this method, you can add any Jet chart from the Jet Cookbook website into Oracle APEX.
Things to Note:
JSON_OBJECT function is supported only in Oracle 12C and above versions.
Adding Jet library CSS might increase your application default font size. You can use the below code in the Inline CSS section to make it normal.
a.t-Header-logo-link:visited{ color:#fff; }
html { font-size:60.5% }
REFERENCES: