
- March 7, 2024
- Posted by: Reshma M
- Categories: AI/ML, Snowflake
INTRODUCTION:
A pivotal responsibility of data/business analysts involves presenting insights to business stakeholders based on provided information. This often entails developing models to identify anomalies within their data. However, the complexity of data science and machine learning requirements frequently hinders analysts from constructing optimal models. Additionally, analysts proficient in SQL may lack familiarity with Python or other programming languages, and the intricacies of refining a model may demand specialized expertise beyond their purview. Anomaly Detection represents one such task, providing insights into standout data points that deviate from the dataset to which they belong. With the ML-driven forecasting and anomaly detection features integrated into Snowflake Cortex, data analysts and other SQL users can enhance their ability to generate precise forecasts and detect outliers within their data directly in Snowflake. This capability eliminates the necessity for learning Python, mastering ML algorithms, or managing infrastructure.
Snowflake Cortex:
With Snowflake Cortex, Snowflake users now have access to a set of functions that easily accelerate everyday analytics and AI app development. In this blog, we have explored the usage of machine learning functions using snowflake cortex within the snowflake environment. In Snowflake Cortex’s anomaly detection, the model generates a forecast for the same time period as the data under scrutiny, subsequently comparing the actual data with the forecast to pinpoint outliers.
What is Anomaly Detection?
Anomaly detection involves pinpointing unusual instances within a dataset. Within the Snowflake Cortex suite, the anomaly detection feature empowers users to develop models for identifying outliers within their time series data. Outliers, which are data points departing significantly from the anticipated range, can significantly influence statistical analyses and the performance of machine learning models trained on the data. Detecting and eliminating outliers can consequently enhance the accuracy and reliability of the outcomes derived from the dataset.
PREREQUISITES:
- Trial Snowflake account.
- Knowledge in SQL Scripting.
- The data should contain :
- A column with a timestamp that is updated at a set interval (every hour, every five minutes, etc.).
- A target column with a certain amount of interest at each time interval.
OVERVIEW:
Using snow sight web UI interface follow the below steps.
- Create Snowflake objects (i.e. warehouse, database, schema, etc.)
- Ingest supplier quality data from internal stage and load it into a snowflake table.
- Preparing data and visualizing the Quality data.
- Building the anomaly detection.
- Productionizing the workflow using stored procedure and tasks.
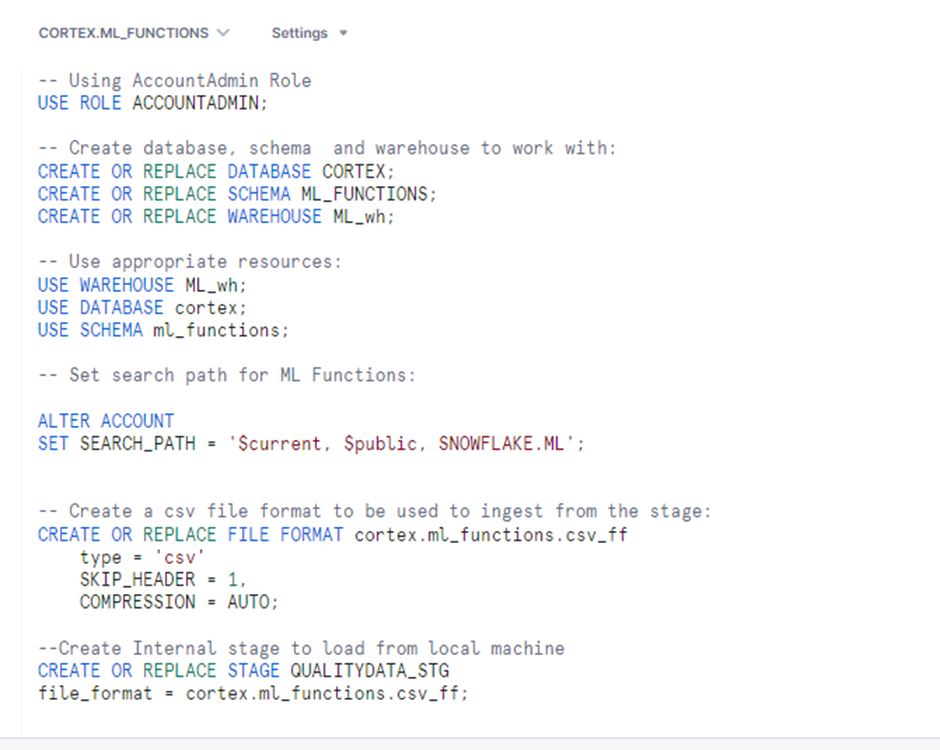
Step 1: Creating and using the snowflake Objects.
- Create a new SQL worksheet and paste the below SQL commands for creating snowflake object and make use of it.
- Below command creates warehouse, database, schema, file format, internal stage and add the search path to use ML function.
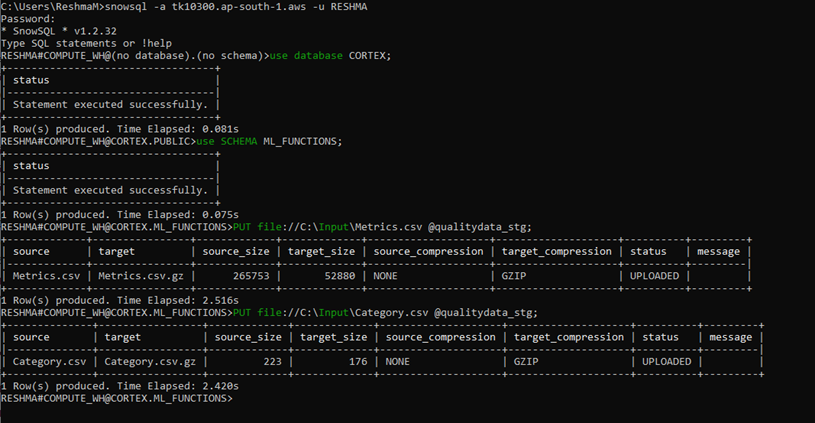
Step 2: Ingest supplier quality data from internal stage and load it into a snowflake table.
Loading csv files into the internal stage via snowsql.
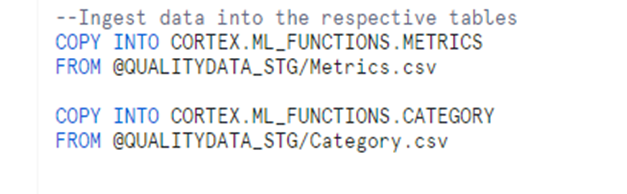
Loading the metrics and category data into the respective tables.
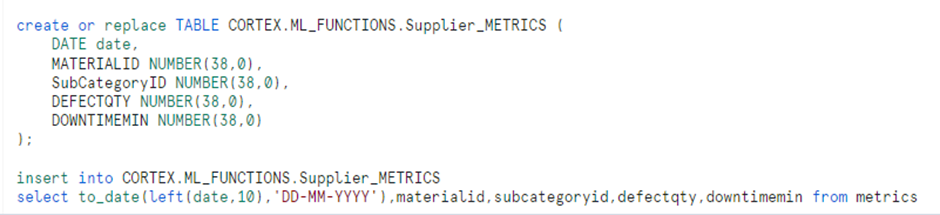
Step 3: Preparing data to identify anomalies in the supplier data.
Taking necessary fields from the metric table for the analysis and deriving the Supplier_metrics table.
Visualizing the Result
First, we need to visualize the data for better understanding to train the model.
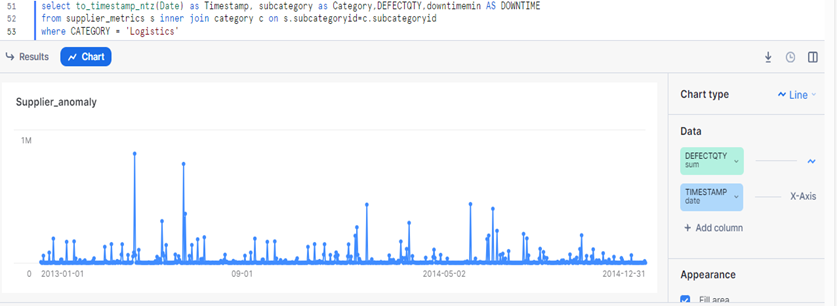
For the above information, we analyse that there are seasonal trends on a yearly basis. Hence, we need to build a trained model for the period of at least one year for better prediction.
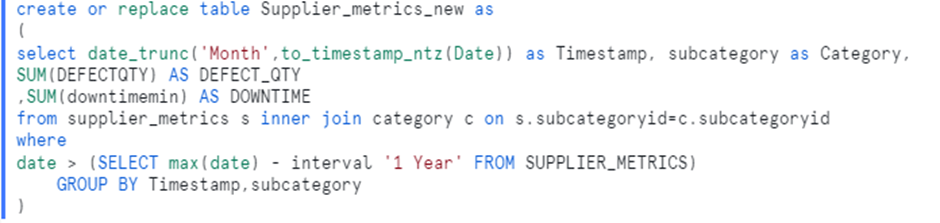
In the query below, we will also convert the date column using the to_timestamp_ntz function, so that it can be used in the Anomaly detection function.
Using supplier data table getting the last 1-year data for the logistics category and creating as Supplier_metrics_new table for prediction:
Anomaly Detection ML function is used to find the abnormalities in the Supplier quality data. It can work in both supervised and unsupervised forms. Here, we are using the unsupervised approach.
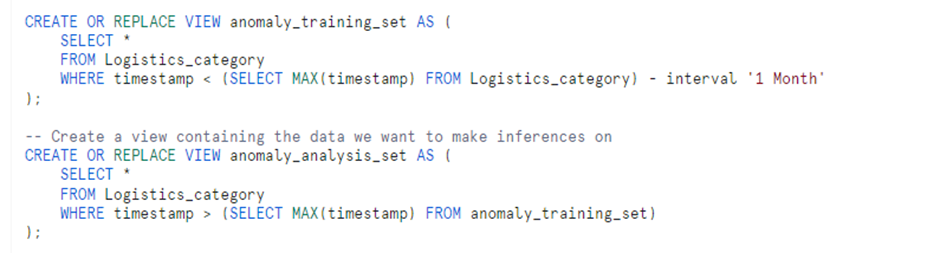
Preparing two sets of data. The training set contains all the data except the last month data & the other is an analysis set containing the last month’s data.
Step 4: Building the anomaly detection model and calling it.
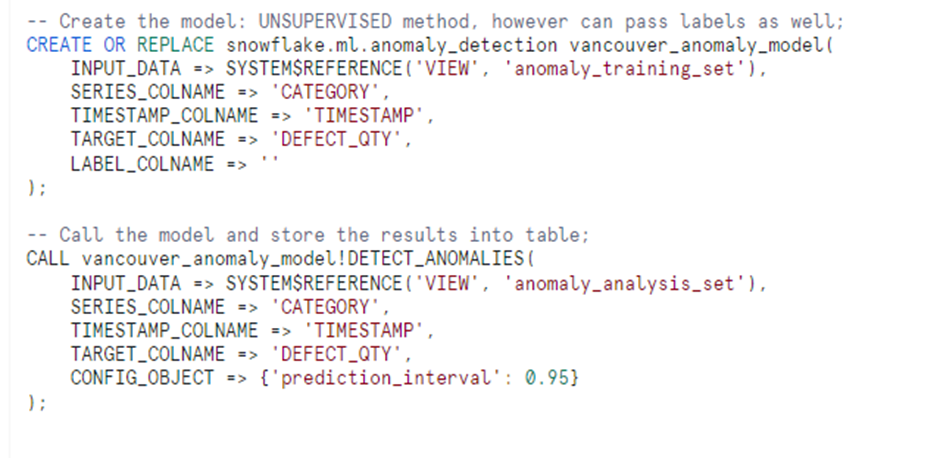
The LABEL_COLNAME choice can be used to indicate a column if you have labels for whether anything was abnormal.
You can also set the prediction_interval. This is employed in this context to regulate the model’s level of “aggression” when detecting an anomaly. Less observations will be classified as abnormal when the value is closer to 1, whereas more occurrences will be classified as anomalous when the value is lower.
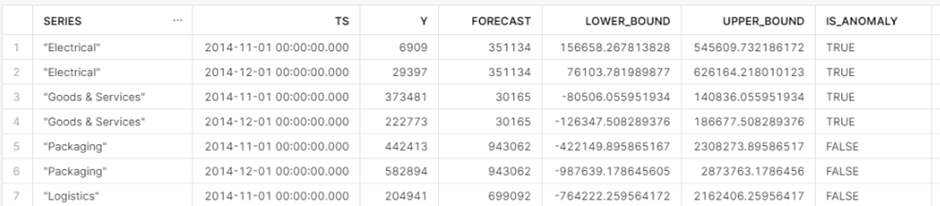
By calling this model, we get the following output:,
Step 5: Productionizing the workflow using stored procedure and tasks.
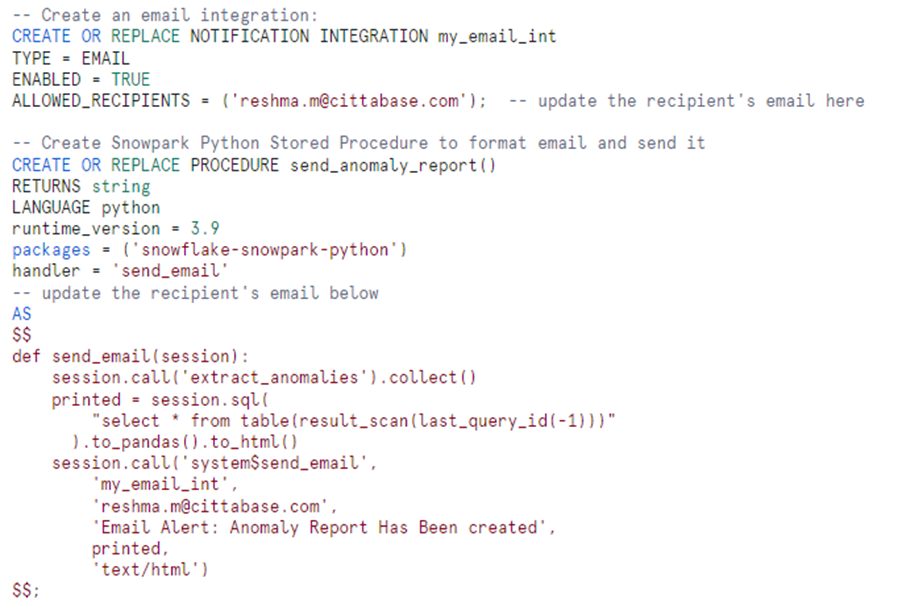
Now, creating a task to define the anomaly_model and a stored procedure to call the model and retrieve data from the last query id executed.
We will also create an email notification service to get the anomalies report.
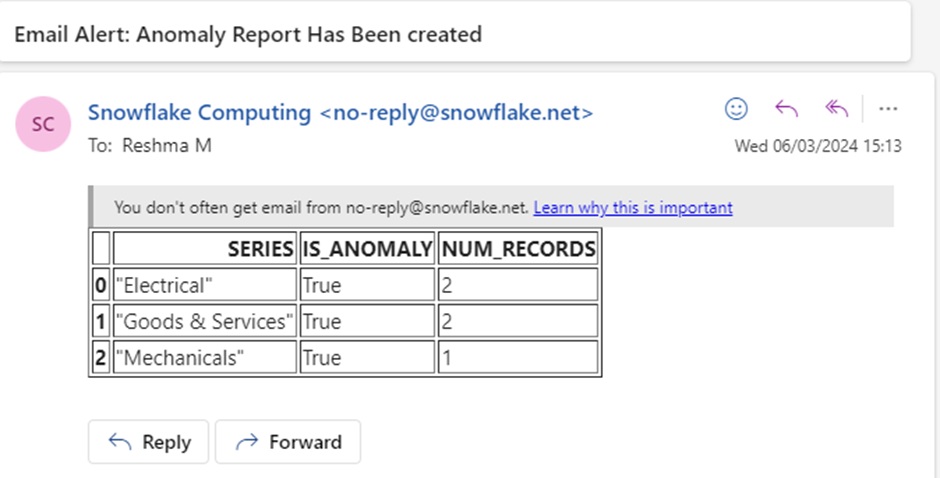
Run the above stored procedure inside a task. An email alert will be generated and sent to the respective mail id.
CONCLUSION:
By following these steps, the Anomaly Detection function within Snowflake Cortex aids in identifying and removing abnormal data points from our dataset. Consequently, the identification and elimination of outliers may contribute to enhancing the quality of your insights and discoveries.
Cittabase is a select partner with Snowflake. Please feel free to contact us regarding your Snowflake solution needs. Our snowflake solutions encompass a suite of services for your data integration and migration needs. We are committed to providing personalized assistance and support customized to your requirements.